BB&T 2007 Annual Report Download - page 19
Download and view the complete annual report
Please find page 19 of the 2007 BB&T annual report below. You can navigate through the pages in the report by either clicking on the pages listed below, or by using the keyword search tool below to find specific information within the annual report.-
 1
1 -
2
-
3
-
4
-
5
-
6
-
7
-
8
-
 9
9 -
 10
10 -
 11
11 -
 12
12 -
 13
13 -
 14
14 -
 15
15 -
 16
16 -
 17
17 -
 18
18 -
 19
19 -
 20
20 -
 21
21 -
 22
22 -
 23
23 -
 24
24 -
 25
25 -
 26
26 -
 27
27 -
 28
28 -
 29
29 -
30
-
31
-
32
-
33
-
34
-
35
-
36
-
37
-
38
-
39
-
40
-
41
-
42
-
43
-
44
-
45
-
46
-
47
-
48
-
49
-
50
-
51
-
52
-
53
-
54
-
55
-
56
-
57
-
58
-
59
-
60
-
61
-
62
-
63
-
64
-
65
-
66
-
67
-
68
-
69
-
70
-
71
-
72
-
73
-
74
-
75
-
76
-
77
-
78
-
79
-
80
-
81
-
82
-
83
-
84
-
85
-
86
-
87
-
88
-
89
-
90
-
91
-
92
-
93
-
94
-
95
-
96
-
97
-
98
-
99
-
100
-
101
-
102
-
103
-
104
-
105
-
106
-
107
-
108
-
109
-
110
-
111
-
112
-
113
-
114
-
115
-
116
-
117
-
118
-
119
-
120
-
121
-
122
-
123
-
124
-
125
-
126
-
127
-
128
-
129
-
130
-
131
-
132
-
133
-
134
-
135
-
136
-
137
 |
 |

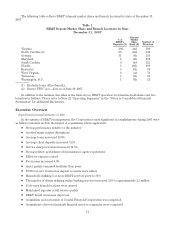
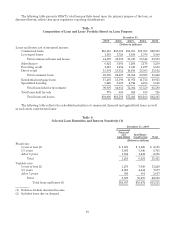
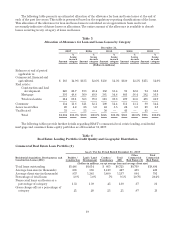
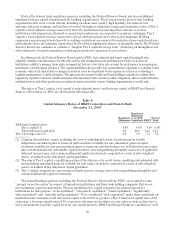
The following table presents an estimated allocation of the allowance for loan and lease losses at the end of
each of the past five years. This table is presented based on the regulatory reporting classifications of the loans.
This allocation of the allowance for loan and lease losses is calculated on an approximate basis and is not
necessarily indicative of future losses or allocations. The entire amount of the allowance is available to absorb
losses occurring in any category of loans and leases.
Table 5
Allocation of Allowance for Loan and Lease Losses by Category
December 31,
2007 2006 2005 2004 2003
Amount
%
Loans
in each
category Amount
%
Loans
in each
category Amount
%
Loans
in each
category Amount
%
Loans
in each
category Amount
%
Loans
in each
category
(Dollars in millions)
Balances at end of period
applicable to:
Commercial, financial and
agricultural $ 183 14.9% $135 12.6% $138 12.3% $130 12.5% $155 12.6%
Real estate:
Construction and land
development 223 20.7 193 20.4 132 15.4 96 12.2 94 10.0
Mortgage 391 48.4 360 49.9 381 54.4 403 56.4 382 56.9
Total real estate 614 69.1 553 70.3 513 69.8 499 68.6 476 66.9
Consumer 134 11.8 121 12.1 100 12.4 111 13.1 80 14.2
Lease receivables 20 4.2 26 5.0 24 5.5 22 5.8 29 6.3
Unallocated 53 — 53 — 50 — 43 — 45 —
Total $1,004 100.0% $888 100.0% $825 100.0% $805 100.0% $785 100.0%
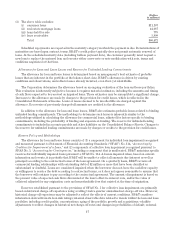
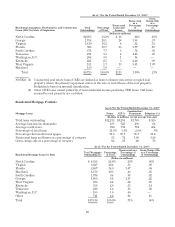
The following tables provide further details regarding BB&T’s commercial real estate lending, residential
mortgage and consumer home equity portfolios as of December 31, 2007.
Table 6
Real Estate Lending Portfolio Credit Quality and Geographic Distribution
Commercial Real Estate Loan Portfolio (1)
As of / For the Period Ended December 31, 2007
Residential Acquisition, Development, and
Construction Loans (ADC) Builder /
Construction Land / Land
Development Condos /
Townhomes Total
ADC
Other
Commercial
Real Estate (2)
Total
Commercial
Real Estate
(Dollars in millions, except average loan and average client size)
Total loans outstanding $3,446 $4,614 $ 665 $8,725 $9,769 $18,494
Average loan size (in thousands) 286 586 1,419 427 433 430
Average client size (in thousands) 857 1,345 3,400 1,137 604 781
Percentage of total loans 3.8% 5.0% .7% 9.5% 10.7% 20.2%
Nonaccrual loans and leases as a
percentage of category 1.33 1.39 .45 1.30 .37 .81
Gross charge-offs as a percentage of
category .21 .20 .23 .21 .07 .13
19