BB&T 2007 Annual Report Download - page 16
Download and view the complete annual report
Please find page 16 of the 2007 BB&T annual report below. You can navigate through the pages in the report by either clicking on the pages listed below, or by using the keyword search tool below to find specific information within the annual report.-
 1
1 -
2
-
3
-
4
-
5
-
 6
6 -
 7
7 -
 8
8 -
 9
9 -
 10
10 -
 11
11 -
 12
12 -
 13
13 -
 14
14 -
 15
15 -
 16
16 -
 17
17 -
 18
18 -
 19
19 -
 20
20 -
 21
21 -
 22
22 -
 23
23 -
 24
24 -
 25
25 -
 26
26 -
27
-
28
-
29
-
30
-
31
-
32
-
33
-
34
-
35
-
36
-
37
-
38
-
39
-
40
-
41
-
42
-
43
-
44
-
45
-
46
-
47
-
48
-
49
-
50
-
51
-
52
-
53
-
54
-
55
-
56
-
57
-
58
-
59
-
60
-
61
-
62
-
63
-
64
-
65
-
66
-
67
-
68
-
69
-
70
-
71
-
72
-
73
-
74
-
75
-
76
-
77
-
78
-
79
-
80
-
81
-
82
-
83
-
84
-
85
-
86
-
87
-
88
-
89
-
90
-
91
-
92
-
93
-
94
-
95
-
96
-
97
-
98
-
99
-
100
-
101
-
102
-
103
-
104
-
105
-
106
-
107
-
108
-
109
-
110
-
111
-
112
-
113
-
114
-
115
-
116
-
117
-
118
-
119
-
120
-
121
-
122
-
123
-
124
-
125
-
126
-
127
-
128
-
129
-
130
-
131
-
132
-
133
-
134
-
135
-
136
-
137
 |
 |

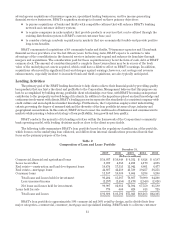
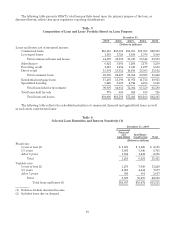
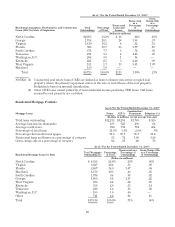
The following table presents BB&T’s total loan portfolio based upon the primary purpose of the loan, as
discussed herein, rather than upon regulatory reporting classifications:
Table 3
Composition of Loan and Lease Portfolio Based on Loan Purpose
December 31,
2007 2006 2005 2004 2003
(Dollars in millions)
Loans and leases, net of unearned income:
Commercial loans $43,685 $39,580 $34,965 $31,968 $29,083
Leveraged leases 1,185 1,720 1,650 1,576 1,500
Total commercial loans and leases 44,870 41,300 36,615 33,544 30,583
Sales finance 6,021 5,683 5,264 5,176 5,250
Revolving credit 1,618 1,414 1,347 1,277 1,180
Direct retail 15,691 15,312 14,453 13,585 11,812
Total consumer loans 23,330 22,409 21,064 20,038 18,242
Residential mortgage loans 17,467 15,596 13,971 11,715 10,915
Specialized Lending 5,240 3,606 2,744 2,253 1,840
Total loans held for investment 90,907 82,911 74,394 67,550 61,580
Total loans held for sale 779 680 629 613 725
Total loans and leases $91,686 $83,591 $75,023 $68,163 $62,305
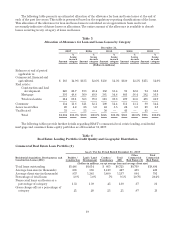
The following table reflects the scheduled maturities of commercial, financial and agricultural loans, as well
as real estate construction loans:
Table 4
Selected Loan Maturities and Interest Sensitivity (1)
December 31, 2007
Commercial,
Financial
and
Agricultural Real Estate:
Construction Total
(Dollars in millions)
Fixed rate:
1 year or less (2) $ 1,695 $ 1,120 $ 2,815
1-5 years 1,861 3,840 5,701
After 5 years 1,654 1,241 2,895
Total 5,210 6,201 11,411
Variable rate:
1 year or less (2) 5,278 7,948 13,226
1-5 years 2,613 4,444 7,057
After 5 years 936 881 1,817
Total 8,827 13,273 22,100
Total loans and leases (3) $14,037 $19,474 $33,511
(1) Balances include unearned income.
(2) Includes loans due on demand.
16