BB&T 2007 Annual Report Download - page 41
Download and view the complete annual report
Please find page 41 of the 2007 BB&T annual report below. You can navigate through the pages in the report by either clicking on the pages listed below, or by using the keyword search tool below to find specific information within the annual report.-
 1
1 -
2
-
3
-
4
-
5
-
6
-
7
-
8
-
9
-
10
-
11
-
12
-
13
-
14
-
15
-
16
-
17
-
18
-
19
-
20
-
21
-
22
-
23
-
24
-
25
-
26
-
27
-
28
-
29
-
30
-
 31
31 -
 32
32 -
 33
33 -
 34
34 -
 35
35 -
 36
36 -
 37
37 -
 38
38 -
 39
39 -
 40
40 -
 41
41 -
 42
42 -
 43
43 -
 44
44 -
 45
45 -
 46
46 -
 47
47 -
 48
48 -
 49
49 -
 50
50 -
 51
51 -
52
-
53
-
54
-
55
-
56
-
57
-
58
-
59
-
60
-
61
-
62
-
63
-
64
-
65
-
66
-
67
-
68
-
69
-
70
-
71
-
72
-
73
-
74
-
75
-
76
-
77
-
78
-
79
-
80
-
81
-
82
-
83
-
84
-
85
-
86
-
87
-
88
-
89
-
90
-
91
-
92
-
93
-
94
-
95
-
96
-
97
-
98
-
99
-
100
-
101
-
102
-
103
-
104
-
105
-
106
-
107
-
108
-
109
-
110
-
111
-
112
-
113
-
114
-
115
-
116
-
117
-
118
-
119
-
120
-
121
-
122
-
123
-
124
-
125
-
126
-
127
-
128
-
129
-
130
-
131
-
132
-
133
-
134
-
135
-
136
-
137
 |
 |

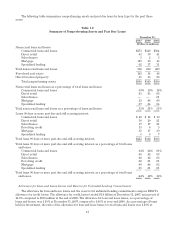
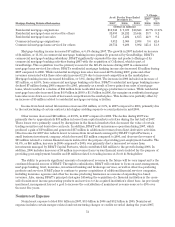
The following table summarizes nonperforming assets and past due loans by loan type for the past three
years.
Table 12
Summary of Nonperforming Assets and Past Due Loans
December 31,
2007 2006 2005
(Dollars in millions)
Nonaccrual loans and leases
Commercial loans and leases $273 $129 $104
Direct retail 43 39 41
Sales finance 525
Mortgage 119 53 48
Specialized lending 62 37 31
Total nonaccrual loans and leases 502 260 229
Foreclosed real estate 143 54 48
Other foreclosed property 51 35 23
Total nonperforming assets $696 $349 $300
Nonaccrual loans and leases as a percentage of total loans and leases
Commercial loans and leases .30% .16% .14%
Direct retail .05 .05 .06
Sales finance — — .01
Mortgage .13 .06 .06
Specialized lending .07 .04 .04
Total nonaccrual loans and leases as a percentage of loans and leases .55% .31% .31%
Loans 90 days or more past due and still accruing interest
Commercial loans and leases $ 40 $ 14 $ 10
Direct retail 58 20 21
Sales finance 17 17 21
Revolving credit 1565
Mortgage 85 37 39
Specialized lending 887
Total loans 90 days or more past due and still accruing interest $223 $102 $103
Total loans 90 days or more past due and still accruing interest as a percentage of total loans
and leases
Commercial loans and leases .04% .02% .01%
Direct retail .06 .02 .03
Sales finance .02 .02 .03
Revolving credit .02 .01 .01
Mortgage .09 .04 .05
Specialized lending .01 .01 .01
Total loans 90 days or more past due and still accruing interest as a percentage of total loans
and leases .24% .12% .14%
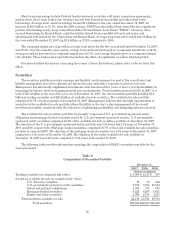
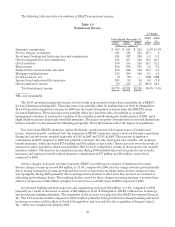
Allowance for Loan and Lease Losses and Reserve for Unfunded Lending Commitments
The allowance for loan and lease losses and the reserve for unfunded lending commitments compose BB&T’s
allowance for credit losses. The allowance for credit losses totaled $1.0 billion at December 31, 2007, an increase of
14.3% compared to $888 million at the end of 2006. The allowance for loan and lease losses, as a percentage of
loans and leases, was 1.10% at December 31, 2007, compared to 1.06% at year-end 2006. As a percentage of loans
held for investment, the ratio of the allowance for loan and lease losses to total loans and leases was 1.10% at
41