BB&T 2007 Annual Report Download - page 37
Download and view the complete annual report
Please find page 37 of the 2007 BB&T annual report below. You can navigate through the pages in the report by either clicking on the pages listed below, or by using the keyword search tool below to find specific information within the annual report.-
 1
1 -
2
-
3
-
4
-
5
-
6
-
7
-
8
-
9
-
10
-
11
-
12
-
13
-
14
-
15
-
16
-
17
-
18
-
19
-
20
-
21
-
22
-
23
-
24
-
25
-
26
-
 27
27 -
 28
28 -
 29
29 -
 30
30 -
 31
31 -
 32
32 -
 33
33 -
 34
34 -
 35
35 -
 36
36 -
 37
37 -
 38
38 -
 39
39 -
 40
40 -
 41
41 -
 42
42 -
 43
43 -
 44
44 -
 45
45 -
 46
46 -
 47
47 -
48
-
49
-
50
-
51
-
52
-
53
-
54
-
55
-
56
-
57
-
58
-
59
-
60
-
61
-
62
-
63
-
64
-
65
-
66
-
67
-
68
-
69
-
70
-
71
-
72
-
73
-
74
-
75
-
76
-
77
-
78
-
79
-
80
-
81
-
82
-
83
-
84
-
85
-
86
-
87
-
88
-
89
-
90
-
91
-
92
-
93
-
94
-
95
-
96
-
97
-
98
-
99
-
100
-
101
-
102
-
103
-
104
-
105
-
106
-
107
-
108
-
109
-
110
-
111
-
112
-
113
-
114
-
115
-
116
-
117
-
118
-
119
-
120
-
121
-
122
-
123
-
124
-
125
-
126
-
127
-
128
-
129
-
130
-
131
-
132
-
133
-
134
-
135
-
136
-
137
 |
 |

At December 31, 2007, trading securities reflected on BB&T’s consolidated balance sheet totaled $1.0 billion
compared to $2.1 billion at December 31, 2006. The decline in the trading portfolio was the result of a $1.1 billion
purchase of municipal securities executed late in 2006, which matured early in 2007.
The $1.7 billion increase in securities available for sale was the result of a combination of factors, including an
increase in funds allocated to the securities portfolio as a result of the acquisition of Coastal, and an increase in
municipal securities with states and political subdivisions primarily due to a new funding program in BB&T’s
Capital Markets Group. During the year ended December 31, 2007, BB&T sold approximately $2.5 billion of
available-for-sale securities and realized net losses totaling $3 million.
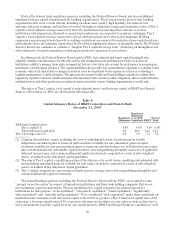
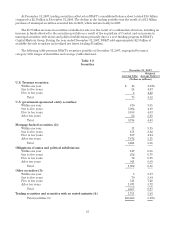
The following table presents BB&T’s securities portfolio at December 31, 2007, segregated by major
category with ranges of maturities and average yields disclosed.
Table 10
Securities
December 31, 2007
Carrying Value Weighted
Average Yield (1)
(Dollars in millions)
U.S. Treasury securities:
Within one year $ 45 4.80%
One to five years 24 4.07
Five to ten years 4 4.22
Total 73 4.52
U.S. government-sponsored entity securities:
Within one year 810 3.81
One to five years 5,004 4.19
Five to ten years 3,858 4.83
After ten years 62 5.95
Total 9,734 4.43
Mortgage-backed securities (2):
Within one year 11 3.15
One to five years 151 3.82
Five to ten years 187 4.94
After ten years 7,872 5.11
Total 8,221 5.08
Obligations of states and political subdivisions:
Within one year 147 6.68
One to five years 232 6.78
Five to ten years 72 6.91
After ten years 941 6.89
Total 1,392 6.86
Other securities (3):
Within one year 5 3.37
One to five years 70 5.84
Five to ten years 511 7.28
After ten years 1,671 5.72
Total 2,257 6.07
Trading securities and securities with no stated maturity (4) 1,751 5.03
Total securities (5) $23,428 5.01%
37