BB&T 2007 Annual Report Download - page 75
Download and view the complete annual report
Please find page 75 of the 2007 BB&T annual report below. You can navigate through the pages in the report by either clicking on the pages listed below, or by using the keyword search tool below to find specific information within the annual report.-
 1
1 -
2
-
3
-
4
-
5
-
6
-
7
-
8
-
9
-
10
-
11
-
12
-
13
-
14
-
15
-
16
-
17
-
18
-
19
-
20
-
21
-
22
-
23
-
24
-
25
-
26
-
27
-
28
-
29
-
30
-
31
-
32
-
33
-
34
-
35
-
36
-
37
-
38
-
39
-
40
-
41
-
42
-
43
-
44
-
45
-
46
-
47
-
48
-
49
-
50
-
51
-
52
-
53
-
54
-
55
-
56
-
57
-
58
-
59
-
60
-
61
-
62
-
63
-
64
-
 65
65 -
 66
66 -
 67
67 -
 68
68 -
 69
69 -
 70
70 -
 71
71 -
 72
72 -
 73
73 -
 74
74 -
 75
75 -
 76
76 -
 77
77 -
 78
78 -
 79
79 -
 80
80 -
 81
81 -
 82
82 -
 83
83 -
 84
84 -
 85
85 -
86
-
87
-
88
-
89
-
90
-
91
-
92
-
93
-
94
-
95
-
96
-
97
-
98
-
99
-
100
-
101
-
102
-
103
-
104
-
105
-
106
-
107
-
108
-
109
-
110
-
111
-
112
-
113
-
114
-
115
-
116
-
117
-
118
-
119
-
120
-
121
-
122
-
123
-
124
-
125
-
126
-
127
-
128
-
129
-
130
-
131
-
132
-
133
-
134
-
135
-
136
-
137
 |
 |

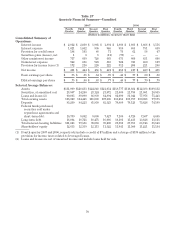
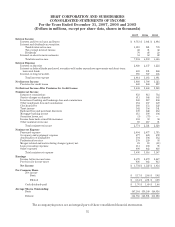
BB&T CORPORATION AND SUBSIDIARIES
CONSOLIDATED STATEMENTS OF INCOME
For the Years Ended December 31, 2007, 2006 and 2005
(Dollars in millions, except per share data, shares in thousands)
2007 2006 2005
Interest Income
Interest and fees on loans and leases $ 6,713 $ 5,941 $ 4,684
Interest and dividends on securities:
Taxable interest income 1,018 821 739
Tax-exempt interest income 42 31 32
Dividends 70 48 29
Interest on short-term investments 51 52 22
Total interest income 7,894 6,893 5,506
Interest Expense
Interest on deposits 2,620 2,137 1,252
Interest on federal funds purchased, securities sold under repurchase agreements and short-term
borrowed funds 409 301 224
Interest on long-term debt 985 747 505
Total interest expense 4,014 3,185 1,981
Net Interest Income 3,880 3,708 3,525
Provision for credit losses 448 240 217
Net Interest Income After Provision for Credit Losses 3,432 3,468 3,308
Noninterest Income
Insurance commissions 853 813 714
Service charges on deposits 611 548 543
Investment banking and brokerage fees and commissions 343 317 290
Other nondeposit fees and commissions 184 167 129
Checkcard fees 180 155 128
Trust income 162 154 141
Bankcard fees and merchant discounts 139 122 112
Mortgage banking income 115 108 104
Securities losses, net (3) (73) —
Income from bank-owned life insurance 101 93 94
Other noninterest income 89 117 71
Total noninterest income 2,774 2,521 2,326
Noninterest Expense
Personnel expense 2,094 2,077 1,785
Occupancy and equipment expense 477 449 472
Amortization of intangibles 104 104 112
Professional services 139 120 93
Merger-related and restructuring charges (gains), net 21 18 (11)
Loan processing expenses 111 103 98
Other expenses 690 645 618
Total noninterest expense 3,636 3,516 3,167
Earnings
Income before income taxes 2,570 2,473 2,467
Provision for income taxes 836 945 813
Net Income $ 1,734 $ 1,528 $ 1,654
Per Common Share
Net income
Basic $ 3.17 $ 2.84 $ 3.02
Diluted $ 3.14 $ 2.81 $ 3.00
Cash dividends paid $ 1.76 $ 1.60 $ 1.46
Average Shares Outstanding
Basic 547,184 539,140 546,916
Diluted 551,755 543,891 551,380
The accompanying notes are an integral part of these consolidated financial statements.
75