BB&T 2007 Annual Report Download - page 90
Download and view the complete annual report
Please find page 90 of the 2007 BB&T annual report below. You can navigate through the pages in the report by either clicking on the pages listed below, or by using the keyword search tool below to find specific information within the annual report.-
 1
1 -
2
-
3
-
4
-
5
-
6
-
7
-
8
-
9
-
10
-
11
-
12
-
13
-
14
-
15
-
16
-
17
-
18
-
19
-
20
-
21
-
22
-
23
-
24
-
25
-
26
-
27
-
28
-
29
-
30
-
31
-
32
-
33
-
34
-
35
-
36
-
37
-
38
-
39
-
40
-
41
-
42
-
43
-
44
-
45
-
46
-
47
-
48
-
49
-
50
-
51
-
52
-
53
-
54
-
55
-
56
-
57
-
58
-
59
-
60
-
61
-
62
-
63
-
64
-
65
-
66
-
67
-
68
-
69
-
70
-
71
-
72
-
73
-
74
-
75
-
76
-
77
-
78
-
79
-
 80
80 -
 81
81 -
 82
82 -
 83
83 -
 84
84 -
 85
85 -
 86
86 -
 87
87 -
 88
88 -
 89
89 -
 90
90 -
 91
91 -
 92
92 -
 93
93 -
 94
94 -
 95
95 -
 96
96 -
 97
97 -
 98
98 -
 99
99 -
 100
100 -
101
-
102
-
103
-
104
-
105
-
106
-
107
-
108
-
109
-
110
-
111
-
112
-
113
-
114
-
115
-
116
-
117
-
118
-
119
-
120
-
121
-
122
-
123
-
124
-
125
-
126
-
127
-
128
-
129
-
130
-
131
-
132
-
133
-
134
-
135
-
136
-
137
 |
 |

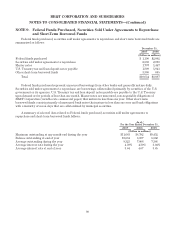
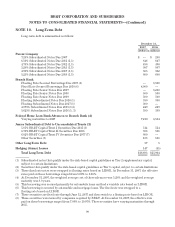
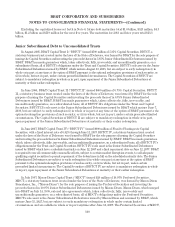
BB&T CORPORATION AND SUBSIDIARIES
NOTES TO CONSOLIDATED FINANCIAL STATEMENTS—(Continued)
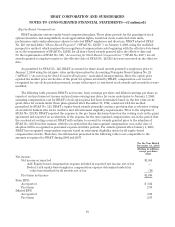
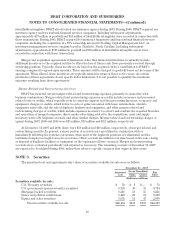
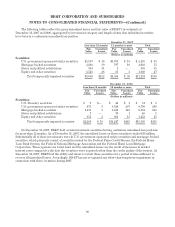
The following tables reflect the gross unrealized losses and fair value of BB&T’s investments at
December 31, 2007 and 2006, aggregated by investment category and length of time that individual securities
have been in a continuous unrealized loss position.
December 31, 2007
Less than 12 months 12 months or more Total
Fair
Value Unrealized
Losses Fair
Value Unrealized
Losses Fair
Value Unrealized
Losses
(Dollars in millions)
Securities:
U.S. government-sponsored entity securities $1,537 $ 16 $3,701 $ 19 $ 5,238 $ 35
Mortgage-backed securities 3,236 39 797 16 4,033 55
States and political subdivisions 354 51 1 — 355 51
Equity and other securities 1,523 46 85 1 1,608 47
Total temporarily impaired securities $6,650 $152 $4,584 $ 36 $11,234 $188
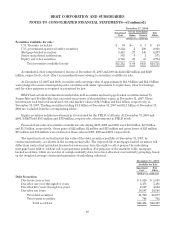
December 31, 2006
Less than 12 months 12 months or more Total
Fair
Value Unrealized
Losses Fair
Value Unrealized
Losses Fair
Value Unrealized
Losses
(Dollars in millions)
Securities:
U.S. Treasury securities $ 9 $— $ 42 $ 1 $ 51 $ 1
U.S. government-sponsored entity securities 475 3 8,324 287 8,799 290
Mortgage-backed securities 1,153 5 5,241 143 6,394 148
States and political subdivisions 1 — 39 1 40 1
Equity and other securities 651 2 601 13 1,252 15
Total temporarily impaired securities $2,289 $ 10 $14,247 $445 $16,536 $455
On December 31, 2007, BB&T held certain investment securities having continuous unrealized loss positions
for more than 12 months. As of December 31, 2007, the unrealized losses on these securities totaled $36 million.
Substantially all of these investments were in U.S. government-sponsored entity securities and mortgage-backed
securities, which primarily consist of securities issued by the Federal Farm Credit Bureau, the Federal Home
Loan Bank System, the Federal National Mortgage Association and the Federal Home Loan Mortgage
Corporation. These agencies are rated AAA and the unrealized losses are the result of increases in market
interest rates compared to the date the securities were acquired rather than the credit quality of the issuers. At
December 31, 2007, BB&T had the ability and intent to retain these securities for a period of time sufficient to
recover all unrealized losses. Accordingly, BB&T has not recognized any other-than-temporary impairment in
connection with these securities during 2007.
90