BB&T 2007 Annual Report Download - page 42
Download and view the complete annual report
Please find page 42 of the 2007 BB&T annual report below. You can navigate through the pages in the report by either clicking on the pages listed below, or by using the keyword search tool below to find specific information within the annual report.-
 1
1 -
2
-
3
-
4
-
5
-
6
-
7
-
8
-
9
-
10
-
11
-
12
-
13
-
14
-
15
-
16
-
17
-
18
-
19
-
20
-
21
-
22
-
23
-
24
-
25
-
26
-
27
-
28
-
29
-
30
-
31
-
 32
32 -
 33
33 -
 34
34 -
 35
35 -
 36
36 -
 37
37 -
 38
38 -
 39
39 -
 40
40 -
 41
41 -
 42
42 -
 43
43 -
 44
44 -
 45
45 -
 46
46 -
 47
47 -
 48
48 -
 49
49 -
 50
50 -
 51
51 -
 52
52 -
53
-
54
-
55
-
56
-
57
-
58
-
59
-
60
-
61
-
62
-
63
-
64
-
65
-
66
-
67
-
68
-
69
-
70
-
71
-
72
-
73
-
74
-
75
-
76
-
77
-
78
-
79
-
80
-
81
-
82
-
83
-
84
-
85
-
86
-
87
-
88
-
89
-
90
-
91
-
92
-
93
-
94
-
95
-
96
-
97
-
98
-
99
-
100
-
101
-
102
-
103
-
104
-
105
-
106
-
107
-
108
-
109
-
110
-
111
-
112
-
113
-
114
-
115
-
116
-
117
-
118
-
119
-
120
-
121
-
122
-
123
-
124
-
125
-
126
-
127
-
128
-
129
-
130
-
131
-
132
-
133
-
134
-
135
-
136
-
137
 |
 |

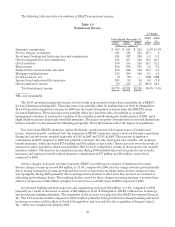
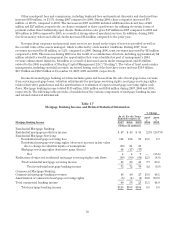
December 31, 2007 compared to 1.07% at the end of last year. The increase in the allowance for loan and leases
losses, as a percentage of total loans outstanding reflects the deteriorating credit quality of the loan portfolio,
primarily related to residential real estate lending. Please refer to Note 5 “Allowance for Loan and Lease Losses
and Reserve for Unfunded Lending Commitments” in the “Notes to Consolidated Financial Statements” for
additional disclosures.
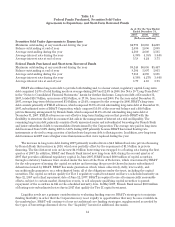
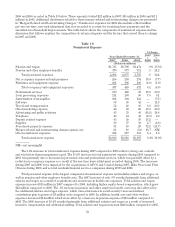
Information relevant to BB&T’s allowance for loan and lease losses for the last five years is presented in the
following table. The table is presented using regulatory classifications.
Table 13
Analysis of Allowance for Credit Losses
December 31,
2007 2006 2005 2004 2003
(Dollars in millions)
Balance, beginning of period $ 888 $ 830 $ 828 $ 793 $ 724
Charge-offs:
Commercial, financial and agricultural (40) (32) (52) (60) (72)
Real estate (93) (46) (45) (61) (78)
Consumer (264) (194) (174) (165) (161)
Lease receivables (8) (5) (6) (11) (5)
Total charge-offs (405) (277) (277) (297) (316)
Recoveries:
Commercial, financial and agricultural 11 12 14 17 25
Real estate 8 7 8 10 11
Consumer 47 41 39 34 30
Lease receivables 11211
Total recoveries 67 61 63 62 67
Net charge-offs (338) (216) (214) (235) (249)
Provision charged to expense 448 240 217 249 248
Allowance for loans (sold) acquired, net 17 34 (1) 21 70
Balance, end of period $ 1,015 $ 888 $ 830 $ 828 $ 793
Average loans and leases (1) $87,952 $79,313 $71,517 $66,107 $57,857
Net charge-offs as a percentage of average loans and leases (1) .38% .27% .30% .36% .43%
(1) Loans and leases are net of unearned income and include loans held for sale.
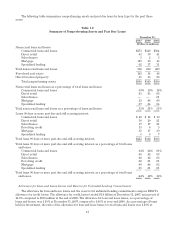
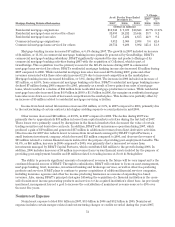
Deposits and Other Borrowings
Client deposits generated through the BB&T banking network are the largest source of funds used to
support asset growth. Total deposits at December 31, 2007, were $86.8 billion, an increase of $5.8 billion, or 7.2%,
compared to year-end 2006. The increase in deposits during 2007 was driven by a $2.8 billion, or 39.4%, increase in
other interest-bearing deposits, a $2.0 billion, or 7.9%, increase in client certificates of deposit (“CDs”), and a $1.4
billion, or 4.2%, increase in other client deposits, which include money rate savings accounts, investor deposit
accounts, savings accounts, individual retirement accounts and other time deposits. These increases were
partially offset by a decline of $334 million, or 2.5%, in noninterest-bearing deposits and a decline of $132 million,
or 9.9%, in interest checking accounts. For the year ended December 31, 2007, total deposits averaged $83.5
billion, an increase of $6.3 billion, or 8.1%, compared to 2006. The increase in average deposits was primarily the
result of a $3.5 billion, or 15.4%, increase in average CDs, and a $2.8 billion, or 8.9%, increase in average other
client deposits. The overall increases in year-end and average deposits included the impact of the acquisition of
Coastal, which was completed during 2007. The increase in average deposits also included the impact of the
acquisitions of Main Street and First Citizens, which were completed during 2006.
42