BB&T 2007 Annual Report Download - page 119
Download and view the complete annual report
Please find page 119 of the 2007 BB&T annual report below. You can navigate through the pages in the report by either clicking on the pages listed below, or by using the keyword search tool below to find specific information within the annual report.-
 1
1 -
2
-
3
-
4
-
5
-
6
-
7
-
8
-
9
-
10
-
11
-
12
-
13
-
14
-
15
-
16
-
17
-
18
-
19
-
20
-
21
-
22
-
23
-
24
-
25
-
26
-
27
-
28
-
29
-
30
-
31
-
32
-
33
-
34
-
35
-
36
-
37
-
38
-
39
-
40
-
41
-
42
-
43
-
44
-
45
-
46
-
47
-
48
-
49
-
50
-
51
-
52
-
53
-
54
-
55
-
56
-
57
-
58
-
59
-
60
-
61
-
62
-
63
-
64
-
65
-
66
-
67
-
68
-
69
-
70
-
71
-
72
-
73
-
74
-
75
-
76
-
77
-
78
-
79
-
80
-
81
-
82
-
83
-
84
-
85
-
86
-
87
-
88
-
89
-
90
-
91
-
92
-
93
-
94
-
95
-
96
-
97
-
98
-
99
-
100
-
101
-
102
-
103
-
104
-
105
-
106
-
107
-
108
-
 109
109 -
 110
110 -
 111
111 -
 112
112 -
 113
113 -
 114
114 -
 115
115 -
 116
116 -
 117
117 -
 118
118 -
 119
119 -
 120
120 -
 121
121 -
 122
122 -
 123
123 -
 124
124 -
 125
125 -
 126
126 -
 127
127 -
 128
128 -
 129
129 -
130
-
131
-
132
-
133
-
134
-
135
-
136
-
137
 |
 |

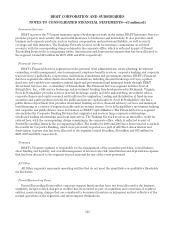
BB&T CORPORATION AND SUBSIDIARIES
NOTES TO CONSOLIDATED FINANCIAL STATEMENTS—(Continued)
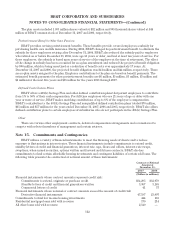
between current levels of interest rates and the committed rates. The fair values of guarantees and letters of
credit are estimated based on the counterparties’ creditworthiness and average default rates for loan products
with similar risks. The fair values of commitments to fund affordable housing investments are estimated using
the net present value of future commitments.
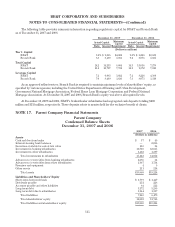
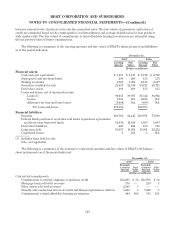
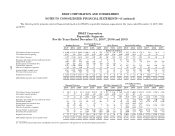
The following is a summary of the carrying amounts and fair values of BB&T’s financial assets and liabilities
as of the period indicated:
December 31,
2007 2006
Carrying
Amount Fair
Value Carrying
Amount Fair
Value
(Dollars in millions)
Financial assets:
Cash and cash equivalents $ 3,117 $ 3,117 $ 2,712 $ 2,712
Segregated cash due from banks 208 208 153 153
Trading securities 1,009 1,009 2,147 2,147
Securities available for sale 22,419 22,419 20,721 20,721
Derivative assets 409 409 135 135
Loans and leases, net of unearned income:
Loans (1) 90,035 89,967 81,342 81,002
Leases 1,651 NA 2,249 NA
Allowance for loan and lease losses (1,004) NA (888) NA
Net loans and leases $90,682 $82,703
Financial liabilities:
Deposits $86,766 84,445 $80,971 77,696
Federal funds purchased, securities sold under repurchase agreements
and short-term borrowed funds 10,634 10,634 8,087 8,087
Derivative liabilities 228 228 180 180
Long-term debt 18,687 18,662 15,901 16,252
Capitalized leases 6 NA 3 NA
(1) Includes loans held for sale.
NA—not applicable
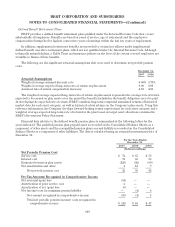
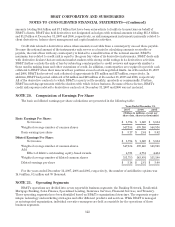
The following is a summary of the notional or contractual amounts and fair values of BB&T’s off-balance
sheet instruments as of the period indicated:
December 31,
2007 2006
Notional/
Contract
Amount Fair
Value
Notional/
Contract
Amount Fair
Value
(Dollars in millions)
Contractual commitments:
Commitments to extend, originate or purchase credit $34,295 $ 52 $32,978 $ 50
Mortgage loans sold with recourse 170 — 214 1
Other assets sold with recourse 2,140 5 — —
Standby and commercial letters of credit and financial guarantees written 3,408 5 3,222 3
Commitments to fund affordable housing investments 444 402 183 161
119