Humana 2014 Annual Report Download - page 102
Download and view the complete annual report
Please find page 102 of the 2014 Humana annual report below. You can navigate through the pages in the report by either clicking on the pages listed below, or by using the keyword search tool below to find specific information within the annual report.-
 1
1 -
2
-
3
-
4
-
5
-
6
-
7
-
8
-
9
-
10
-
11
-
12
-
13
-
14
-
15
-
16
-
17
-
18
-
19
-
20
-
21
-
22
-
23
-
24
-
25
-
26
-
27
-
28
-
29
-
30
-
31
-
32
-
33
-
34
-
35
-
36
-
37
-
38
-
39
-
40
-
41
-
42
-
43
-
44
-
45
-
46
-
47
-
48
-
49
-
50
-
51
-
52
-
53
-
54
-
55
-
56
-
57
-
58
-
59
-
60
-
61
-
62
-
63
-
64
-
65
-
66
-
67
-
68
-
69
-
70
-
71
-
72
-
73
-
74
-
75
-
76
-
77
-
78
-
79
-
80
-
81
-
82
-
83
-
84
-
85
-
86
-
87
-
88
-
89
-
90
-
91
-
 92
92 -
 93
93 -
 94
94 -
 95
95 -
 96
96 -
 97
97 -
 98
98 -
 99
99 -
 100
100 -
 101
101 -
 102
102 -
 103
103 -
 104
104 -
 105
105 -
 106
106 -
 107
107 -
 108
108 -
 109
109 -
 110
110 -
 111
111 -
 112
112 -
113
-
114
-
115
-
116
-
117
-
118
-
119
-
120
-
121
-
122
-
123
-
124
-
125
-
126
-
127
-
128
-
129
-
130
-
131
-
132
-
133
-
134
-
135
-
136
-
137
-
138
-
139
-
140
-
141
-
142
-
143
-
144
-
145
-
146
-
147
-
148
-
149
-
150
-
151
-
152
-
153
-
154
-
155
-
156
-
157
-
158
 |
 |
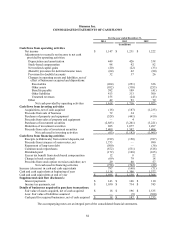
Humana Inc.
NOTES TO CONSOLIDATED FINANCIAL STATEMENTS—(Continued)
94
Earnings Per Common Share
We compute basic earnings per common share on the basis of the weighted-average number of unrestricted common
shares outstanding. Diluted earnings per common share is computed on the basis of the weighted-average number of
unrestricted common shares outstanding plus the dilutive effect of outstanding employee stock options and restricted
shares, or units, using the treasury stock method.
Fair Value
Assets and liabilities measured at fair value are categorized into a fair value hierarchy based on whether the inputs
to valuation techniques are observable or unobservable. Observable inputs reflect market data obtained from independent
sources, while unobservable inputs reflect our own assumptions about the assumptions market participants would use.
The fair value hierarchy includes three levels of inputs that may be used to measure fair value as described below.
Level 1 – Quoted prices in active markets for identical assets or liabilities. Level 1 assets and liabilities include
debt securities that are traded in an active exchange market.
Level 2 – Observable inputs other than Level 1 prices such as quoted prices in active markets for similar assets
or liabilities, quoted prices for identical or similar assets or liabilities in markets that are not active, or other
inputs that are observable or can be corroborated by observable market data for substantially the full term of
the assets or liabilities. Level 2 assets and liabilities include debt securities with quoted prices that are traded
less frequently than exchange-traded instruments as well as debt securities whose value is determined using
a pricing model with inputs that are observable in the market or can be derived principally from or corroborated
by observable market data.
Level 3 – Unobservable inputs that are supported by little or no market activity and are significant to the fair
value of the assets or liabilities. Level 3 includes assets and liabilities whose value is determined using pricing
models, discounted cash flow methodologies, or similar techniques reflecting our own assumptions about the
assumptions market participants would use as well as those requiring significant management judgment.
Fair value of actively traded debt securities are based on quoted market prices. Fair value of other debt securities
are based on quoted market prices of identical or similar securities or based on observable inputs like interest rates
generally using a market valuation approach, or, less frequently, an income valuation approach and are generally
classified as Level 2. We obtain at least one price for each security from a third party pricing service. These prices are
generally derived from recently reported trades for identical or similar securities, including adjustments through the
reporting date based upon observable market information. When quoted prices are not available, the third party pricing
service may use quoted market prices of comparable securities or discounted cash flow analyses, incorporating inputs
that are currently observable in the markets for similar securities. Inputs that are often used in the valuation methodologies
include benchmark yields, reported trades, credit spreads, broker quotes, default rates, and prepayment speeds. We are
responsible for the determination of fair value and as such we perform analysis on the prices received from the third
party pricing service to determine whether the prices are reasonable estimates of fair value. Our analysis includes a
review of monthly price fluctuations as well as a quarterly comparison of the prices received from the pricing service
to prices reported by our third party investment advisor. In addition, on a quarterly basis we examine the underlying
inputs and assumptions for a sample of individual securities across asset classes, credit rating levels, and various
durations.
Fair value of privately held debt securities, as well as auction rate securities, are estimated using a variety of
valuation methodologies, including both market and income approaches, where an observable quoted market does not
exist and are generally classified as Level 3. For privately-held debt securities, such methodologies include reviewing
the value ascribed to the most recent financing, comparing the security with securities of publicly-traded companies
in similar lines of business, and reviewing the underlying financial performance including estimating discounted cash
flows. Auction rate securities are debt instruments with interest rates that reset through periodic short-term auctions.
From time to time, liquidity issues in the credit markets have led to failed auctions. Given the liquidity issues, fair value
could not be estimated based on observable market prices, and as such, unobservable inputs were used. For auction