Humana 2014 Annual Report Download - page 58
Download and view the complete annual report
Please find page 58 of the 2014 Humana annual report below. You can navigate through the pages in the report by either clicking on the pages listed below, or by using the keyword search tool below to find specific information within the annual report.-
 1
1 -
2
-
3
-
4
-
5
-
6
-
7
-
8
-
9
-
10
-
11
-
12
-
13
-
14
-
15
-
16
-
17
-
18
-
19
-
20
-
21
-
22
-
23
-
24
-
25
-
26
-
27
-
28
-
29
-
30
-
31
-
32
-
33
-
34
-
35
-
36
-
37
-
38
-
39
-
40
-
41
-
42
-
43
-
44
-
45
-
46
-
47
-
 48
48 -
 49
49 -
 50
50 -
 51
51 -
 52
52 -
 53
53 -
 54
54 -
 55
55 -
 56
56 -
 57
57 -
 58
58 -
 59
59 -
 60
60 -
 61
61 -
 62
62 -
 63
63 -
 64
64 -
 65
65 -
 66
66 -
 67
67 -
 68
68 -
69
-
70
-
71
-
72
-
73
-
74
-
75
-
76
-
77
-
78
-
79
-
80
-
81
-
82
-
83
-
84
-
85
-
86
-
87
-
88
-
89
-
90
-
91
-
92
-
93
-
94
-
95
-
96
-
97
-
98
-
99
-
100
-
101
-
102
-
103
-
104
-
105
-
106
-
107
-
108
-
109
-
110
-
111
-
112
-
113
-
114
-
115
-
116
-
117
-
118
-
119
-
120
-
121
-
122
-
123
-
124
-
125
-
126
-
127
-
128
-
129
-
130
-
131
-
132
-
133
-
134
-
135
-
136
-
137
-
138
-
139
-
140
-
141
-
142
-
143
-
144
-
145
-
146
-
147
-
148
-
149
-
150
-
151
-
152
-
153
-
154
-
155
-
156
-
157
-
158
 |
 |

50
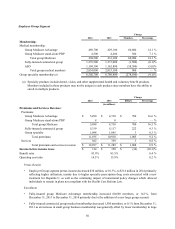
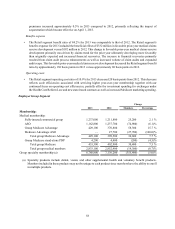
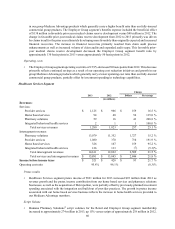
Employer Group Segment
Change
2014 2013 Members Percentage
Membership:
Medical membership:
Group Medicare Advantage 489,700 429,100 60,600 14.1 %
Group Medicare stand-alone PDP 4,500 4,200 300 7.1 %
Total group Medicare 494,200 433,300 60,900 14.1 %
Fully-insured commercial group 1,235,500 1,237,000 (1,500) (0.1)%
ASO 1,104,300 1,162,800 (58,500) (5.0)%
Total group medical members 2,834,000 2,833,100 900 — %
Group specialty membership (a) 6,502,700 6,780,800 (278,100) (4.1)%
(a) Specialty products include dental, vision, and other supplemental health and voluntary benefit products.
Members included in these products may not be unique to each product since members have the ability to
enroll in multiple products.
Change
2014 2013 Dollars Percentage
(in millions)
Premiums and Services Revenue:
Premiums:
Group Medicare Advantage $ 5,490 $ 4,710 $ 780 16.6 %
Group Medicare stand-alone PDP 8 8 — — %
Total group Medicare 5,498 4,718 780 16.5 %
Fully-insured commercial group 5,339 5,117 222 4.3 %
Group specialty 1,098 1,095 3 0.3 %
Total premiums 11,935 10,930 1,005 9.2 %
Services 362 359 3 0.8 %
Total premiums and services revenue $ 12,297 $ 11,289 $ 1,008 8.9 %
Income before income taxes $ 314 $ 350 $ (36) (10.3)%
Benefit ratio 83.9% 83.5% 0.4 %
Operating cost ratio 16.1% 15.9% 0.2 %
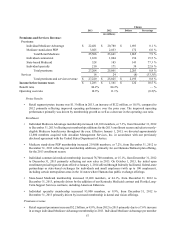
Pretax Results
• Employer Group segment pretax income decreased $36 million, or 10.3%, to $314 million in 2014 primarily
reflecting higher utilization, mainly due to higher specialty prescription drug costs associated with a new
treatment for Hepatitis C, as well as the continuing impact of transitional policy changes which allowed
individuals to remain in plans not compliant with the Health Care Reform Law.
Enrollment
• Fully-insured group Medicare Advantage membership increased 60,600 members, or 14.1%, from
December 31, 2013 to December 31, 2014 primarily due to the addition of a new large group account.
• Fully-insured commercial group medical membership decreased 1,500 members, or 0.1% from December 31,
2013 as an increase in small group business membership was generally offset by lower membership in large