Humana 2014 Annual Report Download - page 110
Download and view the complete annual report
Please find page 110 of the 2014 Humana annual report below. You can navigate through the pages in the report by either clicking on the pages listed below, or by using the keyword search tool below to find specific information within the annual report.-
 1
1 -
2
-
3
-
4
-
5
-
6
-
7
-
8
-
9
-
10
-
11
-
12
-
13
-
14
-
15
-
16
-
17
-
18
-
19
-
20
-
21
-
22
-
23
-
24
-
25
-
26
-
27
-
28
-
29
-
30
-
31
-
32
-
33
-
34
-
35
-
36
-
37
-
38
-
39
-
40
-
41
-
42
-
43
-
44
-
45
-
46
-
47
-
48
-
49
-
50
-
51
-
52
-
53
-
54
-
55
-
56
-
57
-
58
-
59
-
60
-
61
-
62
-
63
-
64
-
65
-
66
-
67
-
68
-
69
-
70
-
71
-
72
-
73
-
74
-
75
-
76
-
77
-
78
-
79
-
80
-
81
-
82
-
83
-
84
-
85
-
86
-
87
-
88
-
89
-
90
-
91
-
92
-
93
-
94
-
95
-
96
-
97
-
98
-
99
-
 100
100 -
 101
101 -
 102
102 -
 103
103 -
 104
104 -
 105
105 -
 106
106 -
 107
107 -
 108
108 -
 109
109 -
 110
110 -
 111
111 -
 112
112 -
 113
113 -
 114
114 -
 115
115 -
 116
116 -
 117
117 -
 118
118 -
 119
119 -
 120
120 -
121
-
122
-
123
-
124
-
125
-
126
-
127
-
128
-
129
-
130
-
131
-
132
-
133
-
134
-
135
-
136
-
137
-
138
-
139
-
140
-
141
-
142
-
143
-
144
-
145
-
146
-
147
-
148
-
149
-
150
-
151
-
152
-
153
-
154
-
155
-
156
-
157
-
158
 |
 |

Humana Inc.
NOTES TO CONSOLIDATED FINANCIAL STATEMENTS—(Continued)
102
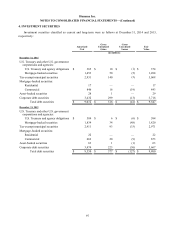
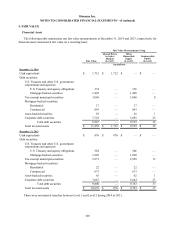
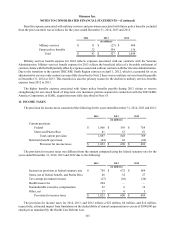
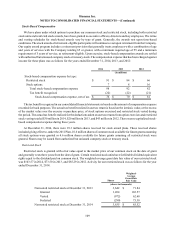
6. MEDICARE PART D
As discussed in Note 2, we cover prescription drug benefits in accordance with Medicare Part D under multiple
contracts with CMS. The consolidated balance sheets include the following amounts associated with Medicare Part D
as of December 31, 2014 and 2013:
2014 2013
Risk
Corridor
Settlement
CMS
Subsidies/
Discounts
Risk
Corridor
Settlement
CMS
Subsidies/
Discounts
(in millions)
Other current assets $ 105 $ 1,690 $ 45 $ 743
Trade accounts payable and accrued expenses (36) (32)(71)(30)
Net current asset (liability) $ 69 $ 1,658 $ (26) $ 713
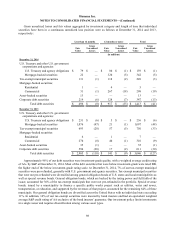
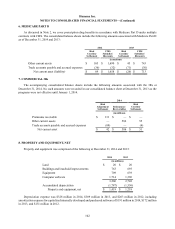
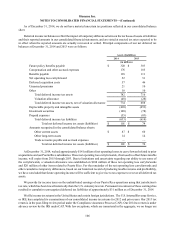
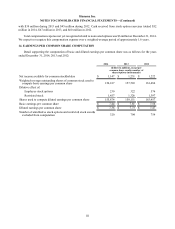
7. COMMERCIAL 3Rs
The accompanying consolidated balance sheets include the following amounts associated with the 3Rs at
December 31, 2014. No such amounts were recorded in our consolidated balance sheet at December 31, 2013 as the
programs were not effective until January 1, 2014.
2014
Risk
Adjustment
Settlement
Reinsurance
Recoverables
Risk
Corridor
Settlement
(in millions)
Premiums receivable $ 131 $ — $ —
Other current assets — 586 55
Trade accounts payable and accrued expenses (89)—(4)
Net current asset $ 42 $ 586 $ 51
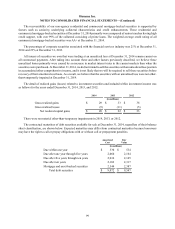
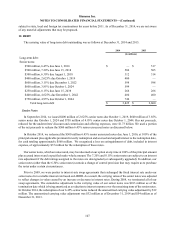
8. PROPERTY AND EQUIPMENT, NET
Property and equipment was comprised of the following at December 31, 2014 and 2013:
2014 2013
(in millions)
Land $ 20 $ 20
Buildings and leasehold improvements 763 693
Equipment 709 639
Computer software 1,714 1,396
3,206 2,748
Accumulated depreciation (1,787) (1,530)
Property and equipment, net $ 1,419 $ 1,218
Depreciation expense was $328 million in 2014, $309 million in 2013, and $263 million in 2012, including
amortization expense for capitalized internally developed and purchased software of $191 million in 2014, $172 million
in 2013, and $151 million in 2012.