Humana 2014 Annual Report Download - page 118
Download and view the complete annual report
Please find page 118 of the 2014 Humana annual report below. You can navigate through the pages in the report by either clicking on the pages listed below, or by using the keyword search tool below to find specific information within the annual report.-
 1
1 -
2
-
3
-
4
-
5
-
6
-
7
-
8
-
9
-
10
-
11
-
12
-
13
-
14
-
15
-
16
-
17
-
18
-
19
-
20
-
21
-
22
-
23
-
24
-
25
-
26
-
27
-
28
-
29
-
30
-
31
-
32
-
33
-
34
-
35
-
36
-
37
-
38
-
39
-
40
-
41
-
42
-
43
-
44
-
45
-
46
-
47
-
48
-
49
-
50
-
51
-
52
-
53
-
54
-
55
-
56
-
57
-
58
-
59
-
60
-
61
-
62
-
63
-
64
-
65
-
66
-
67
-
68
-
69
-
70
-
71
-
72
-
73
-
74
-
75
-
76
-
77
-
78
-
79
-
80
-
81
-
82
-
83
-
84
-
85
-
86
-
87
-
88
-
89
-
90
-
91
-
92
-
93
-
94
-
95
-
96
-
97
-
98
-
99
-
100
-
101
-
102
-
103
-
104
-
105
-
106
-
107
-
 108
108 -
 109
109 -
 110
110 -
 111
111 -
 112
112 -
 113
113 -
 114
114 -
 115
115 -
 116
116 -
 117
117 -
 118
118 -
 119
119 -
 120
120 -
 121
121 -
 122
122 -
 123
123 -
 124
124 -
 125
125 -
 126
126 -
 127
127 -
 128
128 -
129
-
130
-
131
-
132
-
133
-
134
-
135
-
136
-
137
-
138
-
139
-
140
-
141
-
142
-
143
-
144
-
145
-
146
-
147
-
148
-
149
-
150
-
151
-
152
-
153
-
154
-
155
-
156
-
157
-
158
 |
 |

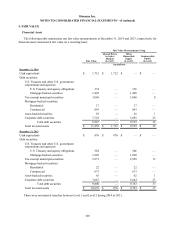
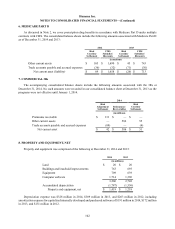
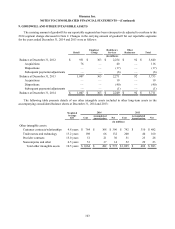
Humana Inc.
NOTES TO CONSOLIDATED FINANCIAL STATEMENTS—(Continued)
110
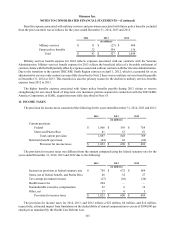
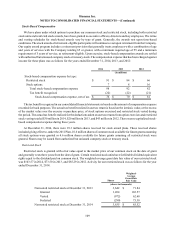
The fair value of shares vested was $99 million during 2014, $52 million during 2013, and $75 million during
2012. Total compensation expense not yet recognized related to nonvested restricted stock was $92 million at
December 31, 2014. We expect to recognize this compensation expense over a weighted-average period of
approximately 1.7 years. There are no other contractual terms covering restricted stock once vested.
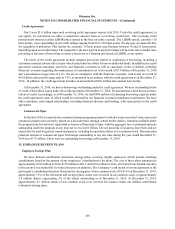
Stock Options
Stock options are granted with an exercise price equal to the fair market value of the underlying common stock
on the date of grant. Our stock plans, as approved by the Board of Directors and stockholders, define fair market value
as the average of the highest and lowest stock prices reported on the composite tape by the New York Stock Exchange
on a given date. Exercise provisions vary, but most options vest in whole or in part 1 to 3 years after grant and expire
7 to 10 years after grant.
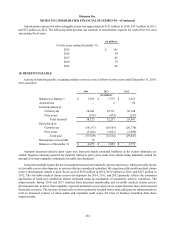
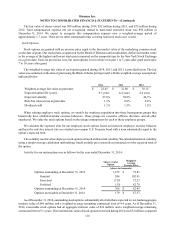
The weighted-average fair value of each option granted during 2014, 2013, and 2012 is provided below. The fair
value was estimated on the date of grant using the Black-Scholes pricing model with the weighted-average assumptions
indicated below:
2014 2013 2012
Weighted-average fair value at grant date $ 22.45 $ 21.80 $ 30.15
Expected option life (years) 4.3 years 4.4 years 4.4 years
Expected volatility 27.6% 38.8% 46.3%
Risk-free interest rate at grant date 1.3% 0.8% 0.8%
Dividend yield 1.1% 1.5% 1.2%
When valuing employee stock options, we stratify the employee population into three homogenous groups that
historically have exhibited similar exercise behaviors. These groups are executive officers, directors, and all other
employees. We value the stock options based on the unique assumptions for each of these employee groups.
We calculate the expected term for our employee stock options based on historical employee exercise behavior
and base the risk-free interest rate on a traded zero-coupon U.S. Treasury bond with a term substantially equal to the
option’s expected term.
The volatility used to value employee stock options is based on historical volatility. We calculate historical volatility
using a simple-average calculation methodology based on daily price intervals as measured over the expected term of
the option.
Activity for our option plans was as follows for the year ended December 31, 2014:
Shares Under
Option
Weighted-
Average
Exercise Price
(shares in thousands)
Options outstanding at December 31, 2013 1,272 $ 72.81
Granted 244 102.91
Exercised (715) 72.27
Forfeited (33) 82.78
Options outstanding at December 31, 2014 768 $ 82.45
Options exercisable at December 31, 2014 179 $ 67.57
As of December 31, 2014, outstanding stock options, substantially all of which are expected to vest, had an aggregate
intrinsic value of $49 million, and a weighted-average remaining contractual term of 4.4 years. As of December 31,
2014, exercisable stock options had an aggregate intrinsic value of $14 million, and a weighted-average remaining
contractual term of 3.1 years. The total intrinsic value of stock options exercised during 2014 was $32 million, compared