Humana 2014 Annual Report Download - page 66
Download and view the complete annual report
Please find page 66 of the 2014 Humana annual report below. You can navigate through the pages in the report by either clicking on the pages listed below, or by using the keyword search tool below to find specific information within the annual report.-
 1
1 -
2
-
3
-
4
-
5
-
6
-
7
-
8
-
9
-
10
-
11
-
12
-
13
-
14
-
15
-
16
-
17
-
18
-
19
-
20
-
21
-
22
-
23
-
24
-
25
-
26
-
27
-
28
-
29
-
30
-
31
-
32
-
33
-
34
-
35
-
36
-
37
-
38
-
39
-
40
-
41
-
42
-
43
-
44
-
45
-
46
-
47
-
48
-
49
-
50
-
51
-
52
-
53
-
54
-
55
-
 56
56 -
 57
57 -
 58
58 -
 59
59 -
 60
60 -
 61
61 -
 62
62 -
 63
63 -
 64
64 -
 65
65 -
 66
66 -
 67
67 -
 68
68 -
 69
69 -
 70
70 -
 71
71 -
 72
72 -
 73
73 -
 74
74 -
 75
75 -
 76
76 -
77
-
78
-
79
-
80
-
81
-
82
-
83
-
84
-
85
-
86
-
87
-
88
-
89
-
90
-
91
-
92
-
93
-
94
-
95
-
96
-
97
-
98
-
99
-
100
-
101
-
102
-
103
-
104
-
105
-
106
-
107
-
108
-
109
-
110
-
111
-
112
-
113
-
114
-
115
-
116
-
117
-
118
-
119
-
120
-
121
-
122
-
123
-
124
-
125
-
126
-
127
-
128
-
129
-
130
-
131
-
132
-
133
-
134
-
135
-
136
-
137
-
138
-
139
-
140
-
141
-
142
-
143
-
144
-
145
-
146
-
147
-
148
-
149
-
150
-
151
-
152
-
153
-
154
-
155
-
156
-
157
-
158
 |
 |

58
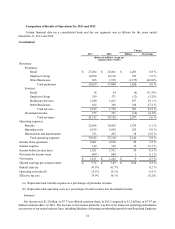
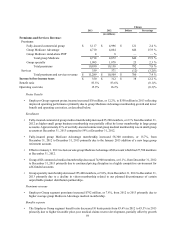
premiums increased approximately 0.5% in 2013 compared to 2012, primarily reflecting the impact of
sequestration which became effective on April 1, 2013.
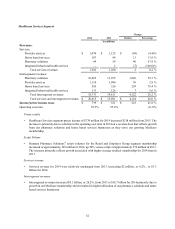
Benefits expense
• The Retail segment benefit ratio of 84.2% for 2013 was comparable to that of 2012. The Retail segment’s
benefits expense for 2013 included the beneficial effect of $332 million in favorable prior-year medical claims
reserve development versus $192 million in 2012. This change in favorable prior-year medical claims reserve
development primarily was driven by claims trend for the prior year ultimately developing more favorably
than originally expected and increased financial recoveries. The increase in financial recoveries primarily
resulted from claim audit process enhancements as well as increased volume of claim audits and expanded
audit scope. This favorable prior-year medical claims reserve development decreased the Retail segment benefit
ratio by approximately 130 basis points in 2013 versus approximately 80 basis points in 2012.
Operating costs
• The Retail segment operating cost ratio of 10.9% for 2013 decreased 20 basis points from 2012. This decrease
reflects scale efficiencies associated with servicing higher year-over-year membership together with our
continued focus on operating cost efficiencies, partially offset by investment spending for exchanges under
the Health Care Reform Law and new state-based contracts as well as increased Medicare marketing spending.
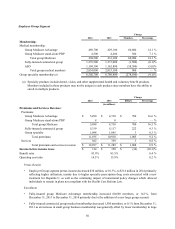
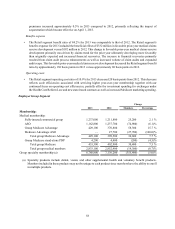
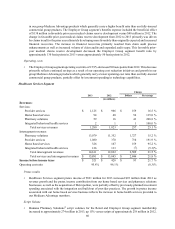
Employer Group Segment
Change
2013 2012 Members Percentage
Membership:
Medical membership:
Fully-insured commercial group 1,237,000 1,211,800 25,200 2.1 %
ASO 1,162,800 1,237,700 (74,900) (6.1)%
Group Medicare Advantage 429,100 370,800 58,300 15.7 %
Medicare Advantage ASO — 27,700 (27,700) (100.0)%
Total group Medicare Advantage 429,100 398,500 30,600 7.7 %
Group Medicare stand-alone PDP 4,200 4,400 (200) (4.5)%
Total group Medicare 433,300 402,900 30,400 7.5 %
Total group medical members 2,833,100 2,852,400 (19,300) (0.7)%
Group specialty membership (a) 6,780,800 7,136,200 (355,400) (5.0)%
(a) Specialty products include dental, vision, and other supplemental health and voluntary benefit products.
Members included in these products may not be unique to each product since members have the ability to enroll
in multiple products.