Humana 2014 Annual Report Download - page 107
Download and view the complete annual report
Please find page 107 of the 2014 Humana annual report below. You can navigate through the pages in the report by either clicking on the pages listed below, or by using the keyword search tool below to find specific information within the annual report.-
 1
1 -
2
-
3
-
4
-
5
-
6
-
7
-
8
-
9
-
10
-
11
-
12
-
13
-
14
-
15
-
16
-
17
-
18
-
19
-
20
-
21
-
22
-
23
-
24
-
25
-
26
-
27
-
28
-
29
-
30
-
31
-
32
-
33
-
34
-
35
-
36
-
37
-
38
-
39
-
40
-
41
-
42
-
43
-
44
-
45
-
46
-
47
-
48
-
49
-
50
-
51
-
52
-
53
-
54
-
55
-
56
-
57
-
58
-
59
-
60
-
61
-
62
-
63
-
64
-
65
-
66
-
67
-
68
-
69
-
70
-
71
-
72
-
73
-
74
-
75
-
76
-
77
-
78
-
79
-
80
-
81
-
82
-
83
-
84
-
85
-
86
-
87
-
88
-
89
-
90
-
91
-
92
-
93
-
94
-
95
-
96
-
 97
97 -
 98
98 -
 99
99 -
 100
100 -
 101
101 -
 102
102 -
 103
103 -
 104
104 -
 105
105 -
 106
106 -
 107
107 -
 108
108 -
 109
109 -
 110
110 -
 111
111 -
 112
112 -
 113
113 -
 114
114 -
 115
115 -
 116
116 -
 117
117 -
118
-
119
-
120
-
121
-
122
-
123
-
124
-
125
-
126
-
127
-
128
-
129
-
130
-
131
-
132
-
133
-
134
-
135
-
136
-
137
-
138
-
139
-
140
-
141
-
142
-
143
-
144
-
145
-
146
-
147
-
148
-
149
-
150
-
151
-
152
-
153
-
154
-
155
-
156
-
157
-
158
 |
 |

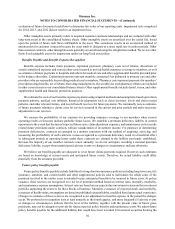
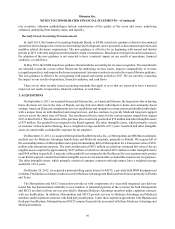
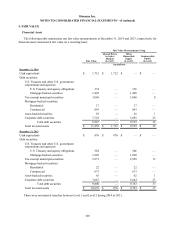
Humana Inc.
NOTES TO CONSOLIDATED FINANCIAL STATEMENTS—(Continued)
99
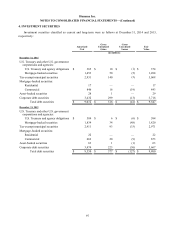
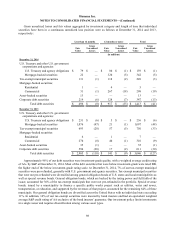
The recoverability of our non-agency residential and commercial mortgage-backed securities is supported by
factors such as seniority, underlying collateral characteristics and credit enhancements. These residential and
commercial mortgage-backed securities at December 31, 2014 primarily were composed of senior tranches having high
credit support, with over 99% of the collateral consisting of prime loans. The weighted average credit rating of all
commercial mortgage-backed securities was AA+ at December 31, 2014.
The percentage of corporate securities associated with the financial services industry was 21% at December 31,
2014 and 23% at December 31, 2013.
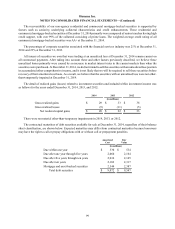
All issuers of securities we own that were trading at an unrealized loss at December 31, 2014 remain current on
all contractual payments. After taking into account these and other factors previously described, we believe these
unrealized losses primarily were caused by an increase in market interest rates in the current markets than when the
securities were purchased. At December 31, 2014, we did not intend to sell the securities with an unrealized loss position
in accumulated other comprehensive income, and it is not likely that we will be required to sell these securities before
recovery of their amortized cost basis. As a result, we believe that the securities with an unrealized loss were not other-
than-temporarily impaired at December 31, 2014.
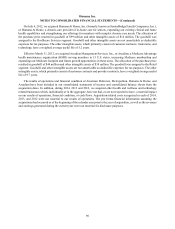
The detail of realized gains (losses) related to investment securities and included within investment income was
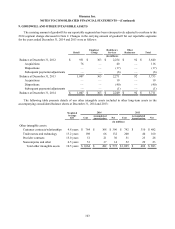
as follows for the years ended December 31, 2014, 2013, and 2012:
2014 2013 2012
(in millions)
Gross realized gains $ 29 $ 33 $ 38
Gross realized losses (9) (11)(5)
Net realized capital gains $ 20 $ 22 $ 33
There were no material other-than-temporary impairments in 2014, 2013, or 2012.
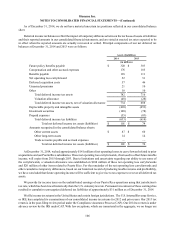
The contractual maturities of debt securities available for sale at December 31, 2014, regardless of their balance
sheet classification, are shown below. Expected maturities may differ from contractual maturities because borrowers
may have the right to call or prepay obligations with or without call or prepayment penalties.
Amortized
Cost
Fair
Value
(in millions)
Due within one year $ 530 $ 534
Due after one year through five years 2,060 2,164
Due after five years through ten years 2,036 2,145
Due after ten years 2,102 2,317
Mortgage and asset-backed securities 2,344 2,387
Total debt securities $ 9,072 $ 9,547