Humana 2014 Annual Report Download - page 56
Download and view the complete annual report
Please find page 56 of the 2014 Humana annual report below. You can navigate through the pages in the report by either clicking on the pages listed below, or by using the keyword search tool below to find specific information within the annual report.-
 1
1 -
2
-
3
-
4
-
5
-
6
-
7
-
8
-
9
-
10
-
11
-
12
-
13
-
14
-
15
-
16
-
17
-
18
-
19
-
20
-
21
-
22
-
23
-
24
-
25
-
26
-
27
-
28
-
29
-
30
-
31
-
32
-
33
-
34
-
35
-
36
-
37
-
38
-
39
-
40
-
41
-
42
-
43
-
44
-
45
-
 46
46 -
 47
47 -
 48
48 -
 49
49 -
 50
50 -
 51
51 -
 52
52 -
 53
53 -
 54
54 -
 55
55 -
 56
56 -
 57
57 -
 58
58 -
 59
59 -
 60
60 -
 61
61 -
 62
62 -
 63
63 -
 64
64 -
 65
65 -
 66
66 -
67
-
68
-
69
-
70
-
71
-
72
-
73
-
74
-
75
-
76
-
77
-
78
-
79
-
80
-
81
-
82
-
83
-
84
-
85
-
86
-
87
-
88
-
89
-
90
-
91
-
92
-
93
-
94
-
95
-
96
-
97
-
98
-
99
-
100
-
101
-
102
-
103
-
104
-
105
-
106
-
107
-
108
-
109
-
110
-
111
-
112
-
113
-
114
-
115
-
116
-
117
-
118
-
119
-
120
-
121
-
122
-
123
-
124
-
125
-
126
-
127
-
128
-
129
-
130
-
131
-
132
-
133
-
134
-
135
-
136
-
137
-
138
-
139
-
140
-
141
-
142
-
143
-
144
-
145
-
146
-
147
-
148
-
149
-
150
-
151
-
152
-
153
-
154
-
155
-
156
-
157
-
158
 |
 |

48
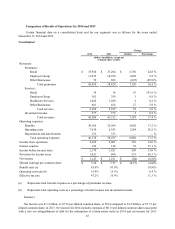
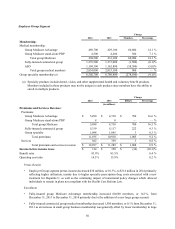
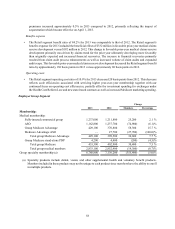
Retail Segment
Change
2014 2013 Members Percentage
Membership:
Medical membership:
Individual Medicare Advantage 2,446,200 2,068,700 377,500 18.2%
Medicare stand-alone PDP 3,989,500 3,271,700 717,800 21.9%
Total Retail Medicare 6,435,700 5,340,400 1,095,300 20.5%
Individual commercial (a) 1,148,100 600,100 548,000 91.3%
State-based Medicaid 298,500 85,500 213,000 249.1%
Total Retail medical members 7,882,300 6,026,000 1,856,300 30.8%
Individual specialty membership (b) 1,165,800 1,042,500 123,300 11.8%
(a) Individual commercial medical membership includes Medicare Supplement members.
(b) Specialty products include dental, vision, and other supplemental health and financial protection products.
Members included in these products may not be unique to each product since members have the ability to enroll
in multiple products.
Change
2014 2013 Dollars Percentage
(in millions)
Premiums and Services Revenue:
Premiums:
Individual Medicare Advantage $ 25,941 $ 22,481 $ 3,460 15.4 %
Medicare stand-alone PDP 3,396 3,025 371 12.3 %
Total Retail Medicare 29,337 25,506 3,831 15.0 %
Individual commercial 3,265 1,160 2,105 181.5 %
State-based Medicaid 1,096 328 768 234.1 %
Individual specialty 256 210 46 21.9 %
Total premiums 33,954 27,204 6,750 24.8 %
Services 39 16 23 143.8 %
Total premiums and services revenue $ 33,993 $ 27,220 $ 6,773 24.9 %
Income before income taxes $ 1,098 $ 1,283 $ (185) (14.4)%
Benefit ratio 84.3% 84.2% 0.1 %
Operating cost ratio 12.4% 10.9% 1.5 %
Pretax Results
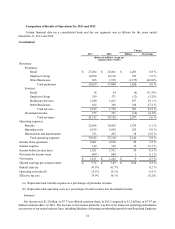
• Retail segment pretax income was $1.1 billion in 2014, a decrease of $185 million, or 14.4%, compared to
2013 primarily driven by investment spending for health care exchanges and state-based contracts and higher
specialty prescription drug costs associated with a new treatment for Hepatitis C, partially offset by Medicare
Advantage and individual commercial medical membership growth as well as increased membership in our
clinical programs.
Enrollment
• Individual Medicare Advantage membership increased 377,500 members, or 18.2%, from December 31, 2013
to December 31, 2014 reflecting net membership additions, particularly for our HMO offerings, for the 2014