Humana 2014 Annual Report Download - page 75
Download and view the complete annual report
Please find page 75 of the 2014 Humana annual report below. You can navigate through the pages in the report by either clicking on the pages listed below, or by using the keyword search tool below to find specific information within the annual report.-
 1
1 -
2
-
3
-
4
-
5
-
6
-
7
-
8
-
9
-
10
-
11
-
12
-
13
-
14
-
15
-
16
-
17
-
18
-
19
-
20
-
21
-
22
-
23
-
24
-
25
-
26
-
27
-
28
-
29
-
30
-
31
-
32
-
33
-
34
-
35
-
36
-
37
-
38
-
39
-
40
-
41
-
42
-
43
-
44
-
45
-
46
-
47
-
48
-
49
-
50
-
51
-
52
-
53
-
54
-
55
-
56
-
57
-
58
-
59
-
60
-
61
-
62
-
63
-
64
-
 65
65 -
 66
66 -
 67
67 -
 68
68 -
 69
69 -
 70
70 -
 71
71 -
 72
72 -
 73
73 -
 74
74 -
 75
75 -
 76
76 -
 77
77 -
 78
78 -
 79
79 -
 80
80 -
 81
81 -
 82
82 -
 83
83 -
 84
84 -
 85
85 -
86
-
87
-
88
-
89
-
90
-
91
-
92
-
93
-
94
-
95
-
96
-
97
-
98
-
99
-
100
-
101
-
102
-
103
-
104
-
105
-
106
-
107
-
108
-
109
-
110
-
111
-
112
-
113
-
114
-
115
-
116
-
117
-
118
-
119
-
120
-
121
-
122
-
123
-
124
-
125
-
126
-
127
-
128
-
129
-
130
-
131
-
132
-
133
-
134
-
135
-
136
-
137
-
138
-
139
-
140
-
141
-
142
-
143
-
144
-
145
-
146
-
147
-
148
-
149
-
150
-
151
-
152
-
153
-
154
-
155
-
156
-
157
-
158
 |
 |

67
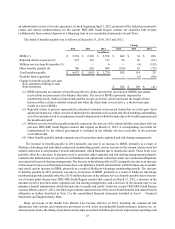
points, or annual interest expense by $2 million, up to a maximum 100 basis points, or annual interest expense by $8
million.
In addition, we operate as a holding company in a highly regulated industry. Humana Inc., our parent company, is
dependent upon dividends and administrative expense reimbursements from our subsidiaries, certain of which are
subject to regulatory restrictions. We continue to maintain significant levels of aggregate excess statutory capital and
surplus in our state-regulated insurance subsidiaries. Cash, cash equivalents, and short-term investments at the parent
company increased to $1.4 billion at December 31, 2014 from $508 million at December 31, 2013 primarily due to net
proceeds of $1.73 billion from the September 2014 issuance of senior notes, offset by the $560 million senior note
redemption discussed above and share repurchases. Our use of operating cash flows derived from our non-insurance
subsidiaries, such as in our Healthcare Services segment, is generally not restricted by Departments of Insurance. Our
subsidiaries paid dividends to the parent of $927 million in 2014, $967 million in 2013, and $1.2 billion in 2012. The
declines in dividends to the parent in 2013 and 2014 primarily were a result of higher surplus requirements associated
with premium growth. Refer to our parent company financial statements and accompanying notes in Schedule I – Parent
Company Financial Information. Regulatory requirements, including subsidiary dividends to the parent, are discussed
in more detail in the following section. Excluding Puerto Rico subsidiaries, the amount of ordinary dividends that may
be paid to our parent company in 2015 is approximately $800 million in the aggregate.
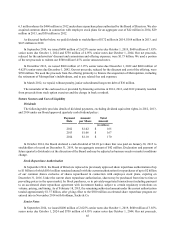
In September 2014, we paid the federal government $562 million for the annual health insurance industry fee
attributed to calendar year 2014, in accordance with the Health Care Reform Law. In 2015, the health insurance industry
fee increases by 41% for the industry taken as a whole. Accordingly, absent changes in market share, we would expect
a 41% increase in our fee in 2015.
Regulatory Requirements
For a detailed discussion of our regulatory requirements, including aggregate statutory capital and surplus as well
as dividends paid from the subsidiaries to the parent, please refer to Note 15 to the consolidated financial statements
included in Item 8. – Financial Statements and Supplementary Data.
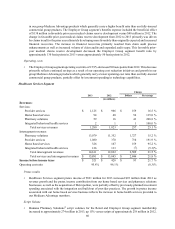
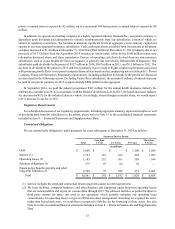
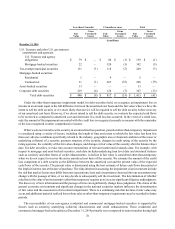
Contractual Obligations
We are contractually obligated to make payments for years subsequent to December 31, 2014 as follows:
Payments Due by Period
Total
Less than
1 Year 1-3 Years 3-5 Years
More than
5 Years
(in millions)
Debt $ 3,800 $ — $ — $ 1,200 $ 2,600
Interest (1) 2,753 187 369 294 1,903
Operating leases (2) 1,145 232 361 188 364
Purchase obligations (3) 175 95 64 16 —
Future policy benefits payable and other
long-term liabilities (4) 2,708 78 398 231 2,001
Total $ 10,581 $ 592 $ 1,192 $ 1,929 $ 6,868
(1) Interest includes the estimated contractual interest payments under our debt agreements.
(2) We lease facilities, computer hardware, and other furniture and equipment under long-term operating leases
that are noncancelable and expire on various dates through 2027. We sublease facilities or partial facilities to
third party tenants for space not used in our operations which partially mitigates our operating lease
commitments. An operating lease is a type of off-balance sheet arrangement. Assuming we acquired the asset,
rather than leased such asset, we would have recognized a liability for the financing of these assets. See also
Note 16 to the consolidated financial statements included in Item 8. – Financial Statements and Supplementary
Data.