Humana 2014 Annual Report Download - page 106
Download and view the complete annual report
Please find page 106 of the 2014 Humana annual report below. You can navigate through the pages in the report by either clicking on the pages listed below, or by using the keyword search tool below to find specific information within the annual report.-
 1
1 -
2
-
3
-
4
-
5
-
6
-
7
-
8
-
9
-
10
-
11
-
12
-
13
-
14
-
15
-
16
-
17
-
18
-
19
-
20
-
21
-
22
-
23
-
24
-
25
-
26
-
27
-
28
-
29
-
30
-
31
-
32
-
33
-
34
-
35
-
36
-
37
-
38
-
39
-
40
-
41
-
42
-
43
-
44
-
45
-
46
-
47
-
48
-
49
-
50
-
51
-
52
-
53
-
54
-
55
-
56
-
57
-
58
-
59
-
60
-
61
-
62
-
63
-
64
-
65
-
66
-
67
-
68
-
69
-
70
-
71
-
72
-
73
-
74
-
75
-
76
-
77
-
78
-
79
-
80
-
81
-
82
-
83
-
84
-
85
-
86
-
87
-
88
-
89
-
90
-
91
-
92
-
93
-
94
-
95
-
 96
96 -
 97
97 -
 98
98 -
 99
99 -
 100
100 -
 101
101 -
 102
102 -
 103
103 -
 104
104 -
 105
105 -
 106
106 -
 107
107 -
 108
108 -
 109
109 -
 110
110 -
 111
111 -
 112
112 -
 113
113 -
 114
114 -
 115
115 -
 116
116 -
117
-
118
-
119
-
120
-
121
-
122
-
123
-
124
-
125
-
126
-
127
-
128
-
129
-
130
-
131
-
132
-
133
-
134
-
135
-
136
-
137
-
138
-
139
-
140
-
141
-
142
-
143
-
144
-
145
-
146
-
147
-
148
-
149
-
150
-
151
-
152
-
153
-
154
-
155
-
156
-
157
-
158
 |
 |

Humana Inc.
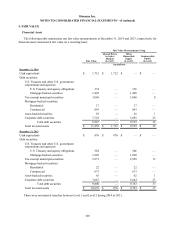
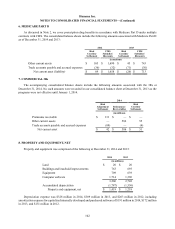
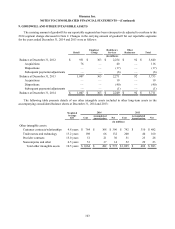
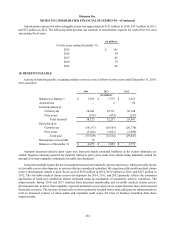
NOTES TO CONSOLIDATED FINANCIAL STATEMENTS—(Continued)
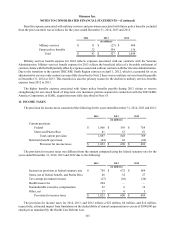
98
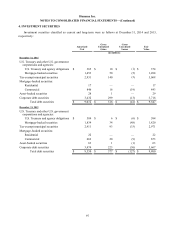
Gross unrealized losses and fair values aggregated by investment category and length of time that individual
securities have been in a continuous unrealized loss position were as follows at December 31, 2014 and 2013,
respectively:
Less than 12 months 12 months or more Total
Fair
Value
Gross
Unrealized
Losses
Fair
Value
Gross
Unrealized
Losses
Fair
Value
Gross
Unrealized
Losses
(in millions)
December 31, 2014
U.S. Treasury and other U.S. government
corporations and agencies:
U.S. Treasury and agency obligations $ 79 $ — $ 80 $ (1) $ 159 $ (1)
Mortgage-backed securities 22 — 320 (5) 342 (5)
Tax-exempt municipal securities 131 (1) 118 (2) 249 (3)
Mortgage-backed securities:
Residential 1 — 4 — 5 —
Commercial 31 (1) 267 (18) 298 (19)
Asset-backed securities 13———13—
Corporate debt securities 219 (6) 128 (7) 347 (13)
Total debt securities $ 496 $ (8) $ 917 $ (33) $ 1,413 $ (41)
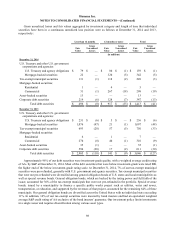
December 31, 2013
U.S. Treasury and other U.S. government
corporations and agencies:
U.S. Treasury and agency obligations $ 231 $ (6)$ 5$ —$ 236$ (6)
Mortgage-backed securities 1,076 (47)21 (1) 1,097 (48)
Tax-exempt municipal securities 693 (28)57 (5) 750 (33)
Mortgage-backed securities:
Residential 6 — 1 — 7 —
Commercial 270 (8)40 (1) 310 (9)
Asset-backed securities 35 (1)——35 (1)
Corporate debt securities 594 (28)17 (2) 611 (30)
Total debt securities $ 2,905 $ (118) $ 141 $ (9) $ 3,046 $ (127)
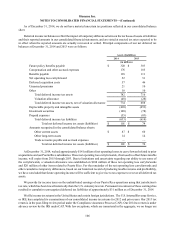
Approximately 96% of our debt securities were investment-grade quality, with a weighted average credit rating
of AA- by S&P at December 31, 2014. Most of the debt securities that were below investment-grade were rated BB,
the higher end of the below investment-grade rating scale. At December 31, 2014, 7% of our tax-exempt municipal
securities were pre-refunded, generally with U.S. government and agency securities. Tax-exempt municipal securities
that were not pre-refunded were diversified among general obligation bonds of U.S. states and local municipalities as
well as special revenue bonds. General obligation bonds, which are backed by the taxing power and full faith of the
issuer, accounted for 36% of the tax-exempt municipals that were not pre-refunded in the portfolio. Special revenue
bonds, issued by a municipality to finance a specific public works project such as utilities, water and sewer,
transportation, or education, and supported by the revenues of that project, accounted for the remaining 64% of these
municipals. Our general obligation bonds are diversified across the United States with no individual state exceeding
11%. In addition, 16% of our tax-exempt securities were insured by bond insurers and had an equivalent weighted
average S&P credit rating of AA exclusive of the bond insurers’ guarantee. Our investment policy limits investments
in a single issuer and requires diversification among various asset types.