Humana 2014 Annual Report Download - page 127
Download and view the complete annual report
Please find page 127 of the 2014 Humana annual report below. You can navigate through the pages in the report by either clicking on the pages listed below, or by using the keyword search tool below to find specific information within the annual report.-
 1
1 -
2
-
3
-
4
-
5
-
6
-
7
-
8
-
9
-
10
-
11
-
12
-
13
-
14
-
15
-
16
-
17
-
18
-
19
-
20
-
21
-
22
-
23
-
24
-
25
-
26
-
27
-
28
-
29
-
30
-
31
-
32
-
33
-
34
-
35
-
36
-
37
-
38
-
39
-
40
-
41
-
42
-
43
-
44
-
45
-
46
-
47
-
48
-
49
-
50
-
51
-
52
-
53
-
54
-
55
-
56
-
57
-
58
-
59
-
60
-
61
-
62
-
63
-
64
-
65
-
66
-
67
-
68
-
69
-
70
-
71
-
72
-
73
-
74
-
75
-
76
-
77
-
78
-
79
-
80
-
81
-
82
-
83
-
84
-
85
-
86
-
87
-
88
-
89
-
90
-
91
-
92
-
93
-
94
-
95
-
96
-
97
-
98
-
99
-
100
-
101
-
102
-
103
-
104
-
105
-
106
-
107
-
108
-
109
-
110
-
111
-
112
-
113
-
114
-
115
-
116
-
 117
117 -
 118
118 -
 119
119 -
 120
120 -
 121
121 -
 122
122 -
 123
123 -
 124
124 -
 125
125 -
 126
126 -
 127
127 -
 128
128 -
 129
129 -
 130
130 -
 131
131 -
 132
132 -
 133
133 -
 134
134 -
 135
135 -
 136
136 -
 137
137 -
138
-
139
-
140
-
141
-
142
-
143
-
144
-
145
-
146
-
147
-
148
-
149
-
150
-
151
-
152
-
153
-
154
-
155
-
156
-
157
-
158
 |
 |
Humana Inc.
NOTES TO CONSOLIDATED FINANCIAL STATEMENTS—(Continued)
119
utilization, and processing claims, act as a principal in the arrangement on behalf of members in our other segments.
As principal, our Healthcare Services segment reports revenues on a gross basis including co-share amounts from
members collected by third party retail pharmacies at the point of service.
In addition, our Healthcare Services intersegment revenues include revenues earned by certain owned providers
derived from risk-based managed care agreements with our health plans. Under these agreements, the provider receives
a monthly capitated fee that varies depending on the demographics and health status of the member, for each member
assigned to these owned providers by our health plans. The owned provider assumes the economic risk of funding the
assigned members’ healthcare services and related administrative costs. Accordingly, our Healthcare Services segment
reports provider services related revenues on a gross basis. Capitation fee revenue is recognized in the period in which
the assigned members are entitled to receive healthcare services.
We present our consolidated results of operations from the perspective of the health plans. As a result, the cost of
providing benefits to our members, whether provided via a third party provider or internally through a stand-alone
subsidiary, is classified as benefits expense and excludes the portion of the cost for which the health plans do not bear
responsibility, including member co-share amounts and government subsidies of $9.7 billion in 2014, $7.3 billion in
2013, and $6.3 billion in 2012. In addition, depreciation and amortization expense associated with certain businesses
in our Healthcare Services segment delivering benefits to our members, primarily associated with our provider services
and pharmacy operations, are included with benefits expense. The amount of this expense was $116 million in 2014,
$93 million in 2013, and $43 million in 2012. The increase in 2013 primarily was due to amortization expense associated
with the December 21, 2012 acquisition of Metropolitan.
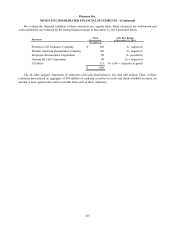
Other than those described previously, the accounting policies of each segment are the same and are described in
Note 2. Transactions between reportable segments consist of sales of services rendered by our Healthcare Services
segment, primarily provider, pharmacy, and behavioral health services, to our Retail and Employer Group customers.
Intersegment sales and expenses are recorded at fair value and eliminated in consolidation. Members served by our
segments often utilize the same provider networks, enabling us in some instances to obtain more favorable contract
terms with providers. Our segments also share indirect costs and assets. As a result, the profitability of each segment
is interdependent. We allocate most operating expenses to our segments. Assets and certain corporate income and
expenses are not allocated to the segments, including the portion of investment income not supporting segment
operations, interest expense on corporate debt, and certain other corporate expenses. These items are managed at a
corporate level. These corporate amounts are reported separately from our reportable segments and included with
intersegment eliminations in the tables presenting segment results below.