Humana 2014 Annual Report Download - page 111
Download and view the complete annual report
Please find page 111 of the 2014 Humana annual report below. You can navigate through the pages in the report by either clicking on the pages listed below, or by using the keyword search tool below to find specific information within the annual report.-
 1
1 -
2
-
3
-
4
-
5
-
6
-
7
-
8
-
9
-
10
-
11
-
12
-
13
-
14
-
15
-
16
-
17
-
18
-
19
-
20
-
21
-
22
-
23
-
24
-
25
-
26
-
27
-
28
-
29
-
30
-
31
-
32
-
33
-
34
-
35
-
36
-
37
-
38
-
39
-
40
-
41
-
42
-
43
-
44
-
45
-
46
-
47
-
48
-
49
-
50
-
51
-
52
-
53
-
54
-
55
-
56
-
57
-
58
-
59
-
60
-
61
-
62
-
63
-
64
-
65
-
66
-
67
-
68
-
69
-
70
-
71
-
72
-
73
-
74
-
75
-
76
-
77
-
78
-
79
-
80
-
81
-
82
-
83
-
84
-
85
-
86
-
87
-
88
-
89
-
90
-
91
-
92
-
93
-
94
-
95
-
96
-
97
-
98
-
99
-
100
-
 101
101 -
 102
102 -
 103
103 -
 104
104 -
 105
105 -
 106
106 -
 107
107 -
 108
108 -
 109
109 -
 110
110 -
 111
111 -
 112
112 -
 113
113 -
 114
114 -
 115
115 -
 116
116 -
 117
117 -
 118
118 -
 119
119 -
 120
120 -
 121
121 -
122
-
123
-
124
-
125
-
126
-
127
-
128
-
129
-
130
-
131
-
132
-
133
-
134
-
135
-
136
-
137
-
138
-
139
-
140
-
141
-
142
-
143
-
144
-
145
-
146
-
147
-
148
-
149
-
150
-
151
-
152
-
153
-
154
-
155
-
156
-
157
-
158
 |
 |

Humana Inc.
NOTES TO CONSOLIDATED FINANCIAL STATEMENTS—(Continued)
103
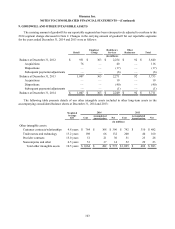
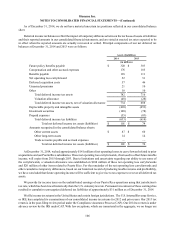
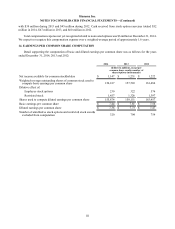
9. GOODWILL AND OTHER INTANGIBLE ASSETS
The carrying amount of goodwill for our reportable segments has been retrospectively adjusted to conform to the
2014 segment change discussed in Note 2. Changes in the carrying amount of goodwill for our reportable segments
for the years ended December 31, 2014 and 2013 were as follows:
Retail
Employer
Group
Healthcare
Services
Other
Businesses Total
(in millions)
Balance at December 31, 2012 $ 931 $ 363 $ 2,254 $ 92 $ 3,640
Acquisitions 76 — 40 — 116
Dispositions — — (17)— (17)
Subsequent payments/adjustments — — (6)— (6)
Balance at December 31, 2013 1,007 363 2,271 92 3,733
Acquisitions — — 19 — 19
Dispositions — — (40)— (40)
Subsequent payments/adjustments — — (1)— (1)
Balance at December 31, 2014 $ 1,007 $ 363 $ 2,249 $ 92 $ 3,711
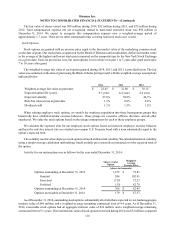
The following table presents details of our other intangible assets included in other long-term assets in the
accompanying consolidated balance sheets at December 31, 2014 and 2013:
Weighted
Average
Life
2014 2013
Cost Accumulated
Amortization Net Cost Accumulated
Amortization Net
(in millions)
Other intangible assets:
Customer contracts/relationships 9.8 years $ 764 $ 368 $ 396 $ 792 $ 310 $ 482
Trade names and technology 13.2 years 198 66 132 200 40 160
Provider contracts 15.0 years 51 21 30 51 23 28
Noncompetes and other 6.5 years 51 37 14 52 29 23
Total other intangible assets 10.5 years $ 1,064 $ 492 $ 572 $ 1,095 $ 402 $ 693