Humana 2014 Annual Report Download - page 20
Download and view the complete annual report
Please find page 20 of the 2014 Humana annual report below. You can navigate through the pages in the report by either clicking on the pages listed below, or by using the keyword search tool below to find specific information within the annual report.-
 1
1 -
2
-
3
-
4
-
5
-
6
-
7
-
8
-
9
-
 10
10 -
 11
11 -
 12
12 -
 13
13 -
 14
14 -
 15
15 -
 16
16 -
 17
17 -
 18
18 -
 19
19 -
 20
20 -
 21
21 -
 22
22 -
 23
23 -
 24
24 -
 25
25 -
 26
26 -
 27
27 -
 28
28 -
 29
29 -
 30
30 -
31
-
32
-
33
-
34
-
35
-
36
-
37
-
38
-
39
-
40
-
41
-
42
-
43
-
44
-
45
-
46
-
47
-
48
-
49
-
50
-
51
-
52
-
53
-
54
-
55
-
56
-
57
-
58
-
59
-
60
-
61
-
62
-
63
-
64
-
65
-
66
-
67
-
68
-
69
-
70
-
71
-
72
-
73
-
74
-
75
-
76
-
77
-
78
-
79
-
80
-
81
-
82
-
83
-
84
-
85
-
86
-
87
-
88
-
89
-
90
-
91
-
92
-
93
-
94
-
95
-
96
-
97
-
98
-
99
-
100
-
101
-
102
-
103
-
104
-
105
-
106
-
107
-
108
-
109
-
110
-
111
-
112
-
113
-
114
-
115
-
116
-
117
-
118
-
119
-
120
-
121
-
122
-
123
-
124
-
125
-
126
-
127
-
128
-
129
-
130
-
131
-
132
-
133
-
134
-
135
-
136
-
137
-
138
-
139
-
140
-
141
-
142
-
143
-
144
-
145
-
146
-
147
-
148
-
149
-
150
-
151
-
152
-
153
-
154
-
155
-
156
-
157
-
158
 |
 |

12
a 50.1% increase compared with approximately 280,200 members at December 31, 2013, reflecting enhanced predictive
modeling capabilities and focus on proactive clinical outreach and member engagement, particularly for our Medicare
Advantage membership. We believe these initiatives lead to better health outcomes for our members and lower health
care costs.
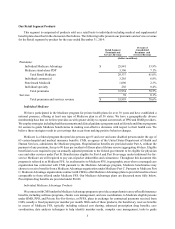
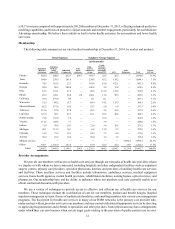
Membership
The following table summarizes our total medical membership at December 31, 2014, by market and product:
Retail Segment Employer Group Segment
(in thousands)
Individual
Medicare
Advantage
Individual
Medicare
stand-
alone PDP
Individual
Commercial
State-
based
contracts
Fully-
insured
commercial
Group
Group
Medicare
Advantage
and stand-
alone PDP ASO
Other
Businesses Total
Percent
of Total
Florida 542.4 300.6 252.7 293.7 189.7 22.6 28.3 — 1,630.0 11.8%
Texas 184.0 258.5 181.6 — 238.6 63.2 118.2 — 1,044.1 7.5%
Kentucky 74.5 185.6 27.3 — 101.8 81.0 472.1 — 942.3 6.8%
Georgia 92.8 90.3 286.4 — 140.8 2.4 15.8 — 628.5 4.5%
Ohio 81.3 121.1 21.9 — 48.6 151.0 139.0 — 562.9 4.1%
Illinois 83.9 126.1 28.8 4.8 108.1 11.6 90.3 — 453.6 3.3%
California 38.4 378.9 9.6 — 0.1 0.1 — — 427.1 3.1%
Wisconsin 51.5 80.2 11.7 — 89.4 14.2 113.3 — 360.3 2.6%
Missouri/Kansas 82.2 175.6 14.3 — 53.3 5.0 6.9 — 337.3 2.4%
Tennessee 119.6 87.6 27.8 — 50.5 2.2 39.5 — 327.2 2.4%
Louisiana 127.9 50.1 22.7 — 63.1 10.5 30.4 — 304.7 2.2%
North Carolina 79.6 139.9 5.9 — — 37.4 — — 262.8 1.9%
Virginia 131.6 104.8 7.7 — — 3.9 — — 248.0 1.8%
Indiana 71.9 99.6 14.3 — 22.0 3.9 19.5 — 231.2 1.7%
Michigan 49.1 113.3 34.1 — 8.8 13.8 3.7 — 222.8 1.6%
Colorado 31.2 75.3 35.1 — 24.3 7.3 0.4 — 173.6 1.3%
Arizona 56.2 65.2 18.6 — 29.4 1.5 1.5 — 172.4 1.2%
Military services —— —————3,090.4 3,090.4 22.3%
Others 548.1 1,536.8 147.6 — 67.0 62.6 25.4 35.0 2,422.5 17.5%
Totals 2,446.2 3,989.5 1,148.1 298.5 1,235.5 494.2 1,104.3 3,125.4 13,841.7 100.0%
Provider Arrangements
We provide our members with access to health care services through our networks of health care providers whom
we employ or with whom we have contracted, including hospitals and other independent facilities such as outpatient
surgery centers, primary care providers, specialist physicians, dentists, and providers of ancillary health care services
and facilities. These ancillary services and facilities include laboratories, ambulance services, medical equipment
services, home health agencies, mental health providers, rehabilitation facilities, nursing homes, optical services, and
pharmacies. Our membership base and the ability to influence where our members seek care generally enable us to
obtain contractual discounts with providers.
We use a variety of techniques to provide access to effective and efficient use of health care services for our
members. These techniques include the coordination of care for our members, product and benefit designs, hospital
inpatient management systems, the use of sophisticated analytics, and enrolling members into various care management
programs. The focal point for health care services in many of our HMO networks is the primary care provider who,
under contract with us, provides services to our members, and may control utilization of appropriate services by directing
or approving hospitalization and referrals to specialists and other providers. Some physicians may have arrangements
under which they can earn bonuses when certain target goals relating to the provision of quality patient care are met.