Humana 2014 Annual Report Download - page 80
Download and view the complete annual report
Please find page 80 of the 2014 Humana annual report below. You can navigate through the pages in the report by either clicking on the pages listed below, or by using the keyword search tool below to find specific information within the annual report.-
 1
1 -
2
-
3
-
4
-
5
-
6
-
7
-
8
-
9
-
10
-
11
-
12
-
13
-
14
-
15
-
16
-
17
-
18
-
19
-
20
-
21
-
22
-
23
-
24
-
25
-
26
-
27
-
28
-
29
-
30
-
31
-
32
-
33
-
34
-
35
-
36
-
37
-
38
-
39
-
40
-
41
-
42
-
43
-
44
-
45
-
46
-
47
-
48
-
49
-
50
-
51
-
52
-
53
-
54
-
55
-
56
-
57
-
58
-
59
-
60
-
61
-
62
-
63
-
64
-
65
-
66
-
67
-
68
-
69
-
 70
70 -
 71
71 -
 72
72 -
 73
73 -
 74
74 -
 75
75 -
 76
76 -
 77
77 -
 78
78 -
 79
79 -
 80
80 -
 81
81 -
 82
82 -
 83
83 -
 84
84 -
 85
85 -
 86
86 -
 87
87 -
 88
88 -
 89
89 -
 90
90 -
91
-
92
-
93
-
94
-
95
-
96
-
97
-
98
-
99
-
100
-
101
-
102
-
103
-
104
-
105
-
106
-
107
-
108
-
109
-
110
-
111
-
112
-
113
-
114
-
115
-
116
-
117
-
118
-
119
-
120
-
121
-
122
-
123
-
124
-
125
-
126
-
127
-
128
-
129
-
130
-
131
-
132
-
133
-
134
-
135
-
136
-
137
-
138
-
139
-
140
-
141
-
142
-
143
-
144
-
145
-
146
-
147
-
148
-
149
-
150
-
151
-
152
-
153
-
154
-
155
-
156
-
157
-
158
 |
 |

72
The favorable medical claims reserve development for 2014, 2013, and 2012 primarily reflects the consistent
application of trend and completion factors estimated using an assumption of moderately adverse conditions. In addition,
the favorable medical claims reserve development during 2014 and 2013 reflects increased membership and better than
originally expected utilization across most of our major business lines and increased financial recoveries. The increase
in financial recoveries primarily resulted from claim audit process enhancements as well as increased volume of claim
audits and expanded audit scope. All lines of business benefited from these improvements.
We continually adjust our historical trend and completion factor experience with our knowledge of recent events
that may impact current trends and completion factors when establishing our reserves. Because our reserving practice
is to consistently recognize the actuarial best point estimate using an assumption of moderately adverse conditions as
required by actuarial standards, there is a reasonable possibility that variances between actual trend and completion
factors and those assumed in our December 31, 2014 estimates would fall towards the middle of the ranges previously
presented in our sensitivity table.
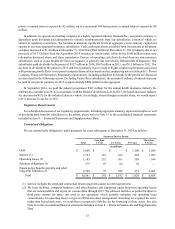
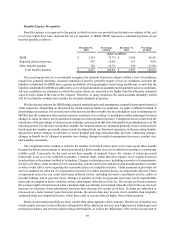
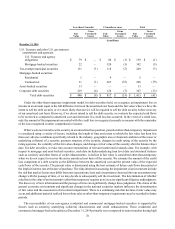
Benefits expense associated with military services and provisions associated with future policy benefits excluded
from the previous table was as follows for the years ended December 31, 2014, 2013 and 2012:
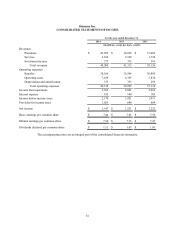
2014 2013 2012
(in millions)
Military services $ 11 $ (27) $ 908
Future policy benefits 32 354 136
Total $ 43 $ 327 $ 1,044
Due to the transition to the current TRICARE South Region contract on April 1, 2012, which is accounted for as
an administrative services only contract as more fully described in Note 2 to the consolidated financial statements
included in Item 8. – Financial Statements and Supplementary Data, there was no military services benefits payable at
December 31, 2014 or 2013. This transition is also the primary reason for the decline in military services benefits
expense from 2012 to 2013.
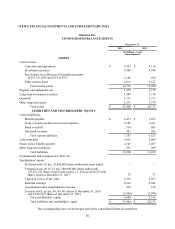
Future policy benefits payable of $2.3 billion and $2.2 billion at December 31, 2014 and 2013, respectively,
represent liabilities for long-duration insurance policies including long-term care insurance, life insurance, annuities,
and certain health and other supplemental policies sold to individuals for which some of the premium received in the
earlier years is intended to pay anticipated benefits to be incurred in future years. At policy issuance, these reserves are
recognized on a net level premium method based on interest rates, mortality, morbidity, and maintenance expense
assumptions. Interest rates are based on our expected net investment returns on the investment portfolio supporting the
reserves for these blocks of business. Mortality, a measure of expected death, and morbidity, a measure of health status,
assumptions are based on published actuarial tables, modified based upon actual experience. The assumptions used to
determine the liability for future policy benefits are established and locked in at the time each contract is issued and
only change if our expected future experience deteriorates to the point that the level of the liability, together with the
present value of future gross premiums, are not adequate to provide for future expected policy benefits and maintenance
costs (i.e. the loss recognition date). Because these policies have long-term claim payout periods, there is a greater risk
of significant variability in claims costs, either positive or negative. We perform loss recognition tests at least annually
in the fourth quarter, and more frequently if adverse events or changes in circumstances indicate that the level of the
liability, together with the present value of future gross premiums, may not be adequate to provide for future expected
policy benefits and maintenance costs.
Future policy benefits payable include $1.5 billion at December 31, 2014 and $1.4 billion at December 31, 2013
associated with a non-strategic closed block of long-term care insurance policies acquired in connection with the 2007
acquisition of KMG. Approximately 32,700 policies remain in force as of December 31, 2014. No new policies have
been written since 2005 under this closed block. Future policy benefits payable includes amounts charged to accumulated
other comprehensive income for an additional liability that would exist on our closed-block of long-term care insurance
policies if unrealized gains on the sale of the investments backing such products had been realized and the proceeds
reinvested at then current yields. There was $123 million of additional liability at December 31, 2014 and no additional