Humana 2014 Annual Report Download - page 119
Download and view the complete annual report
Please find page 119 of the 2014 Humana annual report below. You can navigate through the pages in the report by either clicking on the pages listed below, or by using the keyword search tool below to find specific information within the annual report.-
 1
1 -
2
-
3
-
4
-
5
-
6
-
7
-
8
-
9
-
10
-
11
-
12
-
13
-
14
-
15
-
16
-
17
-
18
-
19
-
20
-
21
-
22
-
23
-
24
-
25
-
26
-
27
-
28
-
29
-
30
-
31
-
32
-
33
-
34
-
35
-
36
-
37
-
38
-
39
-
40
-
41
-
42
-
43
-
44
-
45
-
46
-
47
-
48
-
49
-
50
-
51
-
52
-
53
-
54
-
55
-
56
-
57
-
58
-
59
-
60
-
61
-
62
-
63
-
64
-
65
-
66
-
67
-
68
-
69
-
70
-
71
-
72
-
73
-
74
-
75
-
76
-
77
-
78
-
79
-
80
-
81
-
82
-
83
-
84
-
85
-
86
-
87
-
88
-
89
-
90
-
91
-
92
-
93
-
94
-
95
-
96
-
97
-
98
-
99
-
100
-
101
-
102
-
103
-
104
-
105
-
106
-
107
-
108
-
 109
109 -
 110
110 -
 111
111 -
 112
112 -
 113
113 -
 114
114 -
 115
115 -
 116
116 -
 117
117 -
 118
118 -
 119
119 -
 120
120 -
 121
121 -
 122
122 -
 123
123 -
 124
124 -
 125
125 -
 126
126 -
 127
127 -
 128
128 -
 129
129 -
130
-
131
-
132
-
133
-
134
-
135
-
136
-
137
-
138
-
139
-
140
-
141
-
142
-
143
-
144
-
145
-
146
-
147
-
148
-
149
-
150
-
151
-
152
-
153
-
154
-
155
-
156
-
157
-
158
 |
 |

Humana Inc.
NOTES TO CONSOLIDATED FINANCIAL STATEMENTS—(Continued)
111
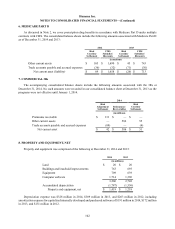
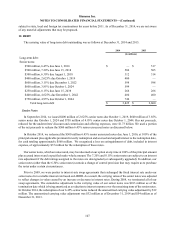
with $39 million during 2013 and $45 million during 2012. Cash received from stock option exercises totaled $52
million in 2014, $67 million in 2013, and $60 million in 2012.
Total compensation expense not yet recognized related to nonvested options was $6 million at December 31, 2014.
We expect to recognize this compensation expense over a weighted-average period of approximately 1.6 years.
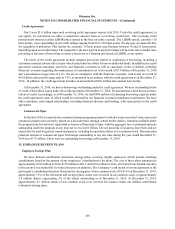
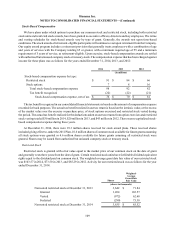
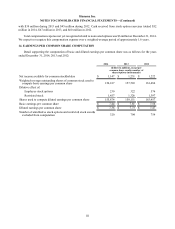
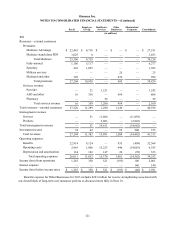
14. EARNINGS PER COMMON SHARE COMPUTATION
Detail supporting the computation of basic and diluted earnings per common share was as follows for the years
ended December 31, 2014, 2013 and 2012:
2014 2013 2012
(dollars in millions, except per
common share results, number of
shares/options in thousands)
Net income available for common stockholders $ 1,147 $ 1,231 $ 1,222
Weighted-average outstanding shares of common stock used to
compute basic earnings per common share 154,187 157,503 161,484
Dilutive effect of:
Employee stock options 230 322 576
Restricted stock 1,457 1,326 1,397
Shares used to compute diluted earnings per common share 155,874 159,151 163,457
Basic earnings per common share $ 7.44 $ 7.81 $ 7.56
Diluted earnings per common share $ 7.36 $ 7.73 $ 7.47
Number of antidilutive stock options and restricted stock awards
excluded from computation 320 704 754