Humana 2014 Annual Report Download - page 48
Download and view the complete annual report
Please find page 48 of the 2014 Humana annual report below. You can navigate through the pages in the report by either clicking on the pages listed below, or by using the keyword search tool below to find specific information within the annual report.-
 1
1 -
2
-
3
-
4
-
5
-
6
-
7
-
8
-
9
-
10
-
11
-
12
-
13
-
14
-
15
-
16
-
17
-
18
-
19
-
20
-
21
-
22
-
23
-
24
-
25
-
26
-
27
-
28
-
29
-
30
-
31
-
32
-
33
-
34
-
35
-
36
-
37
-
 38
38 -
 39
39 -
 40
40 -
 41
41 -
 42
42 -
 43
43 -
 44
44 -
 45
45 -
 46
46 -
 47
47 -
 48
48 -
 49
49 -
 50
50 -
 51
51 -
 52
52 -
 53
53 -
 54
54 -
 55
55 -
 56
56 -
 57
57 -
 58
58 -
59
-
60
-
61
-
62
-
63
-
64
-
65
-
66
-
67
-
68
-
69
-
70
-
71
-
72
-
73
-
74
-
75
-
76
-
77
-
78
-
79
-
80
-
81
-
82
-
83
-
84
-
85
-
86
-
87
-
88
-
89
-
90
-
91
-
92
-
93
-
94
-
95
-
96
-
97
-
98
-
99
-
100
-
101
-
102
-
103
-
104
-
105
-
106
-
107
-
108
-
109
-
110
-
111
-
112
-
113
-
114
-
115
-
116
-
117
-
118
-
119
-
120
-
121
-
122
-
123
-
124
-
125
-
126
-
127
-
128
-
129
-
130
-
131
-
132
-
133
-
134
-
135
-
136
-
137
-
138
-
139
-
140
-
141
-
142
-
143
-
144
-
145
-
146
-
147
-
148
-
149
-
150
-
151
-
152
-
153
-
154
-
155
-
156
-
157
-
158
 |
 |
40
expense on corporate debt, and certain other corporate expenses. These items are managed at the corporate level. These
corporate amounts are reported separately from our reportable segments and included with intersegment eliminations.
Seasonality
One of the product offerings of our Retail segment is Medicare stand-alone prescription drug plans, or PDPs, under
the Medicare Part D program. Our quarterly Retail segment earnings and operating cash flows are impacted by the
Medicare Part D benefit design and changes in the composition of our membership. The Medicare Part D benefit design
results in coverage that varies as a member’s cumulative out-of-pocket costs pass through successive stages of a
member’s plan period, which begins annually on January 1 for renewals. These plan designs generally result in us
sharing a greater portion of the responsibility for total prescription drug costs in the early stages and less in the latter
stages. As a result, the PDP benefit ratio generally decreases as the year progresses. In addition, the number of low-
income senior members as well as year-over-year changes in the mix of membership in our stand-alone PDP products
affects the quarterly benefit ratio pattern.
Our Employer Group segment also experiences seasonality in the benefit ratio pattern. However, the effect is
opposite of Medicare stand-alone PDP in the Retail segment, with the Employer Group’s benefit ratio increasing as
fully-insured members progress through their annual deductible and maximum out-of-pocket expenses. Similarly,
certain of our fully-insured individual commercial medical products in our Retail segment experience seasonality in
the benefit ratio akin to the Employer Group segment, including the effect of existing members transitioning to policies
compliant with the Health Care Reform Law.
In addition, the Retail segment also experiences seasonality in the operating cost ratio as a result of costs incurred
in the second half of the year associated with the Medicare and individual health care exchange marketing seasons.
2014 Highlights
Consolidated
• Our 2014 results reflect the continued implementation of our strategy to offer our members affordable health
care combined with a positive consumer experience in growing markets. At the core of this strategy is our
integrated care delivery model, which unites quality care, high member engagement, and sophisticated data
analytics. Our approach to primary, physician-directed care for our members aims to provide quality care that
is consistent, integrated, cost-effective, and member-focused, provided by both employed physicians and
physicians with network contract arrangements. A core element of the model is to offer assistance to providers
in transitioning from a fee-for-service to a value-based arrangement. The model is designed to improve health
outcomes and affordability for individuals and for the health system as a whole, while offering our members
a simple, seamless healthcare experience. We believe this strategy is positioning us for long-term growth in
both membership and earnings. At December 31, 2014, approximately 709,000 members, or 29.0%, of our
individual Medicare Advantage membership were in risk arrangements under our integrated care delivery
model, as compared to 561,500 members, or 27.1%, at December 31, 2013.
• Year-over-year comparisons of our results were impacted by investments in health care exchanges and state-
based contracts as well as higher specialty prescription drug costs associated with a new treatment for Hepatitis
C, partially offset by membership growth in our Medicare Advantage, Medicare stand-alone PDP, and
individual commercial medical offerings as well as increased membership in our clinical programs.
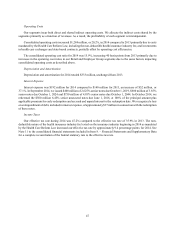
• In September 2014, we paid the federal government $562 million for the annual health insurance industry fee.
This fee is not deductible for tax purposes, which has significantly increased our effective income tax rate in
2014. Year-over-year comparisons of the operating cost ratio are negatively impacted by this and other fees
mandated by the Health Care Reform Law beginning in 2014. Likewise, year-over-year comparisons of the
benefit ratio reflect the inclusion of these mandated fees in the pricing of our products for 2014. In 2015, the
health insurance industry fee increases by 41% for the industry taken as a whole. Accordingly, absent changes
in market share, we would expect a 41% increase in our fee in 2015. The health insurance industry fee is
further described below under the section titled “Health Care Reform.”