Humana 2014 Annual Report Download - page 62
Download and view the complete annual report
Please find page 62 of the 2014 Humana annual report below. You can navigate through the pages in the report by either clicking on the pages listed below, or by using the keyword search tool below to find specific information within the annual report.-
 1
1 -
2
-
3
-
4
-
5
-
6
-
7
-
8
-
9
-
10
-
11
-
12
-
13
-
14
-
15
-
16
-
17
-
18
-
19
-
20
-
21
-
22
-
23
-
24
-
25
-
26
-
27
-
28
-
29
-
30
-
31
-
32
-
33
-
34
-
35
-
36
-
37
-
38
-
39
-
40
-
41
-
42
-
43
-
44
-
45
-
46
-
47
-
48
-
49
-
50
-
51
-
 52
52 -
 53
53 -
 54
54 -
 55
55 -
 56
56 -
 57
57 -
 58
58 -
 59
59 -
 60
60 -
 61
61 -
 62
62 -
 63
63 -
 64
64 -
 65
65 -
 66
66 -
 67
67 -
 68
68 -
 69
69 -
 70
70 -
 71
71 -
 72
72 -
73
-
74
-
75
-
76
-
77
-
78
-
79
-
80
-
81
-
82
-
83
-
84
-
85
-
86
-
87
-
88
-
89
-
90
-
91
-
92
-
93
-
94
-
95
-
96
-
97
-
98
-
99
-
100
-
101
-
102
-
103
-
104
-
105
-
106
-
107
-
108
-
109
-
110
-
111
-
112
-
113
-
114
-
115
-
116
-
117
-
118
-
119
-
120
-
121
-
122
-
123
-
124
-
125
-
126
-
127
-
128
-
129
-
130
-
131
-
132
-
133
-
134
-
135
-
136
-
137
-
138
-
139
-
140
-
141
-
142
-
143
-
144
-
145
-
146
-
147
-
148
-
149
-
150
-
151
-
152
-
153
-
154
-
155
-
156
-
157
-
158
 |
 |

54
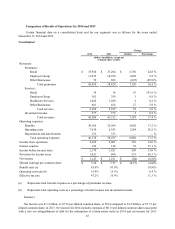
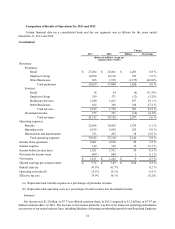
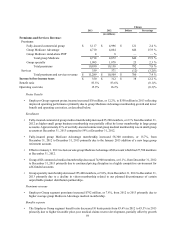
Comparison of Results of Operations for 2013 and 2012
Certain financial data on a consolidated basis and for our segments was as follows for the years ended
December 31, 2013 and 2012:
Consolidated
Change
2013 2012 Dollars Percentage
(dollars in millions, except per
common share results)
Revenues:
Premiums:
Retail $ 27,204 $ 25,001 $ 2,203 8.8 %
Employer Group 10,930 10,138 792 7.8 %
Other Businesses 695 1,870 (1,175) (62.8)%
Total premiums 38,829 37,009 1,820 4.9 %
Services:
Retail 16 24 (8) (33.3)%
Employer Group 359 371 (12) (3.2)%
Healthcare Services 1,280 1,023 257 25.1 %
Other Businesses 454 308 146 47.4 %
Total services 2,109 1,726 383 22.2 %
Investment income 375 391 (16) (4.1)%
Total revenues 41,313 39,126 2,187 5.6 %
Operating expenses:
Benefits 32,564 30,985 1,579 5.1 %
Operating costs 6,355 5,830 525 9.0 %
Depreciation and amortization 333 295 38 12.9 %
Total operating expenses 39,252 37,110 2,142 5.8 %
Income from operations 2,061 2,016 45 2.2 %
Interest expense 140 105 35 33.3 %
Income before income taxes 1,921 1,911 10 0.5 %
Provision for income taxes 690 689 1 0.1 %
Net income $ 1,231 $ 1,222 $ 9 0.7 %
Diluted earnings per common share $ 7.73 $ 7.47 $ 0.26 3.5 %
Benefit ratio (a) 83.9% 83.7% 0.2 %
Operating cost ratio (b) 15.5% 15.1% 0.4 %
Effective tax rate 35.9% 36.1% (0.2)%
(a) Represents total benefits expense as a percentage of premiums revenue.
(b) Represents total operating costs as a percentage of total revenues less investment income.
Summary
Net income was $1.2 billion, or $7.73 per diluted common share, in 2013 compared to $1.2 billion, or $7.47 per
diluted common share, in 2012. The increase in net income primarily was driven by improved operating performance
across most of our major business lines, including Medicare Advantage membership growth in our Retail and Employer