Humana 2014 Annual Report Download - page 57
Download and view the complete annual report
Please find page 57 of the 2014 Humana annual report below. You can navigate through the pages in the report by either clicking on the pages listed below, or by using the keyword search tool below to find specific information within the annual report.-
 1
1 -
2
-
3
-
4
-
5
-
6
-
7
-
8
-
9
-
10
-
11
-
12
-
13
-
14
-
15
-
16
-
17
-
18
-
19
-
20
-
21
-
22
-
23
-
24
-
25
-
26
-
27
-
28
-
29
-
30
-
31
-
32
-
33
-
34
-
35
-
36
-
37
-
38
-
39
-
40
-
41
-
42
-
43
-
44
-
45
-
46
-
 47
47 -
 48
48 -
 49
49 -
 50
50 -
 51
51 -
 52
52 -
 53
53 -
 54
54 -
 55
55 -
 56
56 -
 57
57 -
 58
58 -
 59
59 -
 60
60 -
 61
61 -
 62
62 -
 63
63 -
 64
64 -
 65
65 -
 66
66 -
 67
67 -
68
-
69
-
70
-
71
-
72
-
73
-
74
-
75
-
76
-
77
-
78
-
79
-
80
-
81
-
82
-
83
-
84
-
85
-
86
-
87
-
88
-
89
-
90
-
91
-
92
-
93
-
94
-
95
-
96
-
97
-
98
-
99
-
100
-
101
-
102
-
103
-
104
-
105
-
106
-
107
-
108
-
109
-
110
-
111
-
112
-
113
-
114
-
115
-
116
-
117
-
118
-
119
-
120
-
121
-
122
-
123
-
124
-
125
-
126
-
127
-
128
-
129
-
130
-
131
-
132
-
133
-
134
-
135
-
136
-
137
-
138
-
139
-
140
-
141
-
142
-
143
-
144
-
145
-
146
-
147
-
148
-
149
-
150
-
151
-
152
-
153
-
154
-
155
-
156
-
157
-
158
 |
 |
49
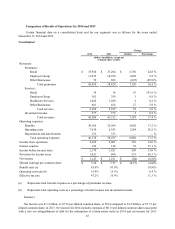
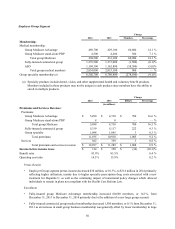
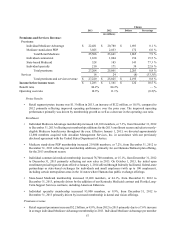
plan year as well as dual eligible members from state-based contracts in Virginia and Illinois. Individual
Medicare Advantage membership at December 31, 2014 includes 18,300 dual eligible members from state-
based contracts.
• Medicare stand-alone PDP membership increased 717,800 members, or 21.9%, from December 31, 2013 to
December 31, 2014 reflecting net membership additions, primarily for our Humana-Walmart plan offering,
for the 2014 plan year.
• Individual commercial medical membership increased 548,000 members, or 91.3%, from December 31, 2013
to December 31, 2014 primarily reflecting new sales, both on-exchange and off-exchange, of plans compliant
with the Health Care Reform Law.
• State-based Medicaid membership increased 213,000 members, or 249.1%, from December 31, 2013 to
December 31, 2014 primarily driven by the addition of members under our Florida Medicaid and Florida
Long-Term Support Services contracts.
• Individual specialty membership increased 123,300 members, or 11.8%, from December 31, 2013 to
December 31, 2014 primarily driven by increased membership in dental and vision offerings.
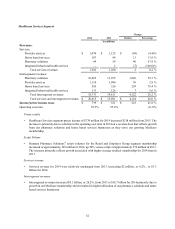
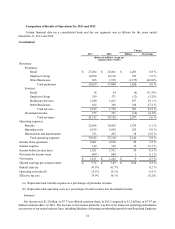
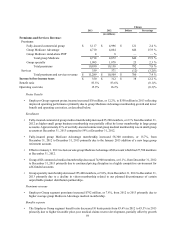
Premiums revenue
• Retail segment premiums increased $6.8 billion, or 24.8%, from 2013 to 2014 primarily due to membership
growth across all lines of business, particularly for our individual Medicare Advantage, individual commercial
medical, primarily on the health care exchanges, and state-based Medicaid businesses. Individual Medicare
Advantage average membership increased 17.0% in 2014. Individual Medicare Advantage per member
premiums decreased approximately 1.4% in 2014 compared to 2013, primarily due to Medicare rate reductions
and the impact of sequestration which became effective on April 1, 2013.
Benefits expense
• The Retail segment benefit ratio of 84.3% for 2014 increased 10 basis points from 2013 primarily due to higher
specialty prescription drug costs associated with a new treatment for Hepatitis C, higher planned clinical
investment spending, and higher benefit ratios associated with members from state-based contracts, partially
offset by increased membership in our clinical programs and the inclusion of the health insurance industry fee
in the pricing of our products.
• The Retail segment’s benefits expense for 2014 included the beneficial effect of $385 million in favorable
prior-year medical claims reserve development versus $332 million in 2013. This favorable prior-year medical
claims reserve development decreased the Retail segment benefit ratio by approximately 110 basis points in
2014 versus approximately 120 basis points in 2013.
Operating costs
• The Retail segment operating cost ratio of 12.4% for 2014 increased 150 basis points from 2013 primarily
due to the non-deductible health insurance industry fee mandated by the Health Care Reform Law and
investment spending for health care exchanges and state-based contracts, partially offset by scale efficiencies
from Medicare and individual commercial medical membership growth.