Humana 2014 Annual Report Download - page 64
Download and view the complete annual report
Please find page 64 of the 2014 Humana annual report below. You can navigate through the pages in the report by either clicking on the pages listed below, or by using the keyword search tool below to find specific information within the annual report.-
 1
1 -
2
-
3
-
4
-
5
-
6
-
7
-
8
-
9
-
10
-
11
-
12
-
13
-
14
-
15
-
16
-
17
-
18
-
19
-
20
-
21
-
22
-
23
-
24
-
25
-
26
-
27
-
28
-
29
-
30
-
31
-
32
-
33
-
34
-
35
-
36
-
37
-
38
-
39
-
40
-
41
-
42
-
43
-
44
-
45
-
46
-
47
-
48
-
49
-
50
-
51
-
52
-
53
-
 54
54 -
 55
55 -
 56
56 -
 57
57 -
 58
58 -
 59
59 -
 60
60 -
 61
61 -
 62
62 -
 63
63 -
 64
64 -
 65
65 -
 66
66 -
 67
67 -
 68
68 -
 69
69 -
 70
70 -
 71
71 -
 72
72 -
 73
73 -
 74
74 -
75
-
76
-
77
-
78
-
79
-
80
-
81
-
82
-
83
-
84
-
85
-
86
-
87
-
88
-
89
-
90
-
91
-
92
-
93
-
94
-
95
-
96
-
97
-
98
-
99
-
100
-
101
-
102
-
103
-
104
-
105
-
106
-
107
-
108
-
109
-
110
-
111
-
112
-
113
-
114
-
115
-
116
-
117
-
118
-
119
-
120
-
121
-
122
-
123
-
124
-
125
-
126
-
127
-
128
-
129
-
130
-
131
-
132
-
133
-
134
-
135
-
136
-
137
-
138
-
139
-
140
-
141
-
142
-
143
-
144
-
145
-
146
-
147
-
148
-
149
-
150
-
151
-
152
-
153
-
154
-
155
-
156
-
157
-
158
 |
 |

56
Businesses as discussed above, partially offset by the increase in favorable prior-year medical claims reserve
development of $217 million from 2012 to 2013.
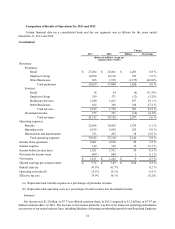
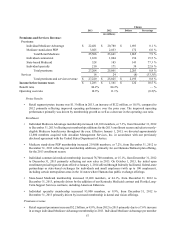
Operating Costs
Our segments incur both direct and shared indirect operating costs. We allocate the indirect costs shared by the
segments primarily as a function of revenues. As a result, the profitability of each segment is interdependent.
Consolidated operating costs increased $525 million, or 9.0%, in 2013 compared to 2012 primarily due to an
increase in operating costs in our Retail and Healthcare Services segments. The increase in the Retail segment primarily
reflects investment spending for exchanges under the Health Care Reform Law and new state-based contracts as well
as increased marketing spending for Medicare.
The consolidated operating cost ratio for 2013 was 15.5%, increasing 40 basis points from 2012. The impact of
the current TRICARE South Region contract being accounted for as an administrative services fee only arrangement
beginning April 1, 2012 was partially offset by improved operating leverage in our Retail and Employer Group segments.
Depreciation and Amortization
Depreciation and amortization for 2013 totaled $333 million, an increase of $38 million, or 12.9%, from 2012
primarily due to capital expenditures and depreciation and amortization associated with 2012 and 2013 acquisitions.
Interest Expense
Interest expense was $140 million for 2013 compared to $105 million for 2012, an increase of $35 million, or
33.3%. In December 2012, we issued $600 million of 3.15% senior notes due December 1, 2022 and $400 million of
4.625% senior notes due December 1, 2042.
Income Taxes
Our effective tax rate during 2013 was 35.9% compared to the effective tax rate of 36.1% in 2012. See Note 11 to
the consolidated financial statements included in Item 8. – Financial Statements and Supplementary Data for a complete
reconciliation of the federal statutory rate to the effective tax rate.
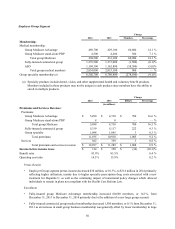
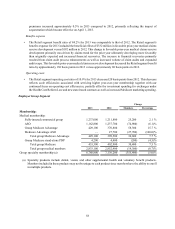
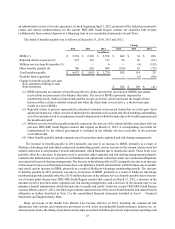
Retail Segment
Change
2013 2012 Members Percentage
Membership:
Medical membership:
Individual Medicare Advantage 2,068,700 1,927,600 141,100 7.3%
Medicare stand-alone PDP 3,271,700 3,052,700 219,000 7.2%
Total Retail Medicare 5,340,400 4,980,300 360,100 7.2%
Individual commercial 600,100 521,400 78,700 15.1%
State-based Medicaid 85,500 52,100 33,400 64.1%
Total Retail medical members 6,026,000 5,553,800 472,200 8.5%
Individual specialty membership (a) 1,042,500 948,700 93,800 9.9%
(a) Specialty products include dental, vision, and other supplemental health and financial protection products.
Members included in these products may not be unique to each product since members have the ability to enroll
in multiple products.