Humana 2014 Annual Report Download - page 108
Download and view the complete annual report
Please find page 108 of the 2014 Humana annual report below. You can navigate through the pages in the report by either clicking on the pages listed below, or by using the keyword search tool below to find specific information within the annual report.-
 1
1 -
2
-
3
-
4
-
5
-
6
-
7
-
8
-
9
-
10
-
11
-
12
-
13
-
14
-
15
-
16
-
17
-
18
-
19
-
20
-
21
-
22
-
23
-
24
-
25
-
26
-
27
-
28
-
29
-
30
-
31
-
32
-
33
-
34
-
35
-
36
-
37
-
38
-
39
-
40
-
41
-
42
-
43
-
44
-
45
-
46
-
47
-
48
-
49
-
50
-
51
-
52
-
53
-
54
-
55
-
56
-
57
-
58
-
59
-
60
-
61
-
62
-
63
-
64
-
65
-
66
-
67
-
68
-
69
-
70
-
71
-
72
-
73
-
74
-
75
-
76
-
77
-
78
-
79
-
80
-
81
-
82
-
83
-
84
-
85
-
86
-
87
-
88
-
89
-
90
-
91
-
92
-
93
-
94
-
95
-
96
-
97
-
 98
98 -
 99
99 -
 100
100 -
 101
101 -
 102
102 -
 103
103 -
 104
104 -
 105
105 -
 106
106 -
 107
107 -
 108
108 -
 109
109 -
 110
110 -
 111
111 -
 112
112 -
 113
113 -
 114
114 -
 115
115 -
 116
116 -
 117
117 -
 118
118 -
119
-
120
-
121
-
122
-
123
-
124
-
125
-
126
-
127
-
128
-
129
-
130
-
131
-
132
-
133
-
134
-
135
-
136
-
137
-
138
-
139
-
140
-
141
-
142
-
143
-
144
-
145
-
146
-
147
-
148
-
149
-
150
-
151
-
152
-
153
-
154
-
155
-
156
-
157
-
158
 |
 |

Humana Inc.
NOTES TO CONSOLIDATED FINANCIAL STATEMENTS—(Continued)
100
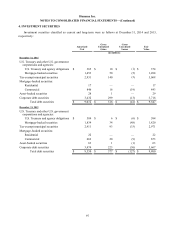
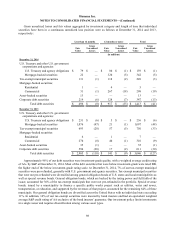
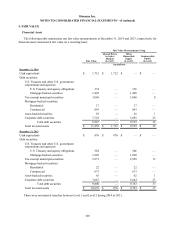
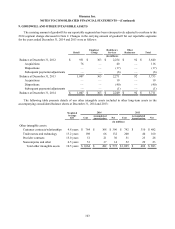
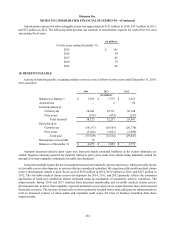
5. FAIR VALUE
Financial Assets
The following table summarizes our fair value measurements at December 31, 2014 and 2013, respectively, for
financial assets measured at fair value on a recurring basis:
Fair Value Measurements Using
Fair Value
Quoted Prices
in Active
Markets
(Level 1)
Other
Observable
Inputs
(Level 2)
Unobservable
Inputs
(Level 3)
(in millions)
December 31, 2014
Cash equivalents $ 1,712 $ 1,712 $ — $ —
Debt securities:
U.S. Treasury and other U.S. government
corporations and agencies:
U.S. Treasury and agency obligations 374 — 374 —
Mortgage-backed securities 1,498 — 1,498 —
Tax-exempt municipal securities 3,068 — 3,060 8
Mortgage-backed securities:
Residential 17 — 17 —
Commercial 843 — 843 —
Asset-backed securities 29 — 28 1
Corporate debt securities 3,718 — 3,695 23
Total debt securities 9,547 — 9,515 32
Total invested assets $ 11,259 $ 1,712 $ 9,515 $ 32
December 31, 2013
Cash equivalents $ 876 $ 876 $ — $ —
Debt securities:
U.S. Treasury and other U.S. government
corporations and agencies:
U.S. Treasury and agency obligations 584 — 584 —
Mortgage-backed securities 1,820 — 1,820 —
Tax-exempt municipal securities 2,971 — 2,958 13
Mortgage-backed securities:
Residential 22 — 22 —
Commercial 673 — 673 —
Asset-backed securities 63 — 62 1
Corporate debt securities 3,667 — 3,644 23
Total debt securities 9,800 — 9,763 37
Total invested assets $ 10,676 $ 876 $ 9,763 $ 37
There were no material transfers between Level 1 and Level 2 during 2014 or 2013.