Humana 2014 Annual Report Download - page 68
Download and view the complete annual report
Please find page 68 of the 2014 Humana annual report below. You can navigate through the pages in the report by either clicking on the pages listed below, or by using the keyword search tool below to find specific information within the annual report.-
 1
1 -
2
-
3
-
4
-
5
-
6
-
7
-
8
-
9
-
10
-
11
-
12
-
13
-
14
-
15
-
16
-
17
-
18
-
19
-
20
-
21
-
22
-
23
-
24
-
25
-
26
-
27
-
28
-
29
-
30
-
31
-
32
-
33
-
34
-
35
-
36
-
37
-
38
-
39
-
40
-
41
-
42
-
43
-
44
-
45
-
46
-
47
-
48
-
49
-
50
-
51
-
52
-
53
-
54
-
55
-
56
-
57
-
 58
58 -
 59
59 -
 60
60 -
 61
61 -
 62
62 -
 63
63 -
 64
64 -
 65
65 -
 66
66 -
 67
67 -
 68
68 -
 69
69 -
 70
70 -
 71
71 -
 72
72 -
 73
73 -
 74
74 -
 75
75 -
 76
76 -
 77
77 -
 78
78 -
79
-
80
-
81
-
82
-
83
-
84
-
85
-
86
-
87
-
88
-
89
-
90
-
91
-
92
-
93
-
94
-
95
-
96
-
97
-
98
-
99
-
100
-
101
-
102
-
103
-
104
-
105
-
106
-
107
-
108
-
109
-
110
-
111
-
112
-
113
-
114
-
115
-
116
-
117
-
118
-
119
-
120
-
121
-
122
-
123
-
124
-
125
-
126
-
127
-
128
-
129
-
130
-
131
-
132
-
133
-
134
-
135
-
136
-
137
-
138
-
139
-
140
-
141
-
142
-
143
-
144
-
145
-
146
-
147
-
148
-
149
-
150
-
151
-
152
-
153
-
154
-
155
-
156
-
157
-
158
 |
 |

60
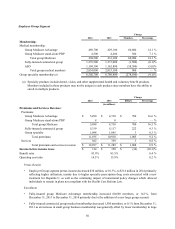
in our group Medicare Advantage products which generally carry a higher benefit ratio than our fully-insured
commercial group products. The Employer Group segment’s benefits expense included the beneficial effect
of $138 million in favorable prior-year medical claims reserve development versus $48 million in 2012. The
change in favorable prior-year medical claims reserve development from 2012 to 2013 primarily was driven
by claims trend for the prior year ultimately developing more favorably than originally expected and increased
financial recoveries. The increase in financial recoveries primarily resulted from claim audit process
enhancements as well as increased volume of claim audits and expanded audit scope. This favorable prior-
year medical claims reserve development decreased the Employer Group segment benefit ratio by
approximately 130 basis points in 2013 versus approximately 50 basis points in 2012.
Operating costs
• The Employer Group segment operating cost ratio of 15.9% decreased 30 basis points from 2012. This decrease
primarily reflects continued savings as a result of our operating cost reduction initiatives and growth in our
group Medicare Advantage products which generally carry a lower operating cost ratio than our fully-insured
commercial group products, partially offset by investment spending in technology capabilities.
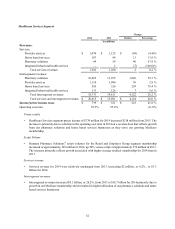
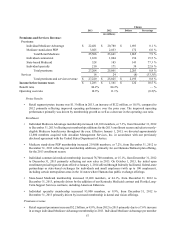
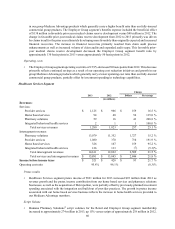
Healthcare Services Segment
Change
2013 2012 Dollars Percentage
(in millions)
Revenues:
Services:
Provider services $ 1,125 $ 966 $ 159 16.5 %
Home based services 94 40 54 135.0 %
Pharmacy solutions 59 16 43 268.8 %
Integrated behavioral health services 2 1 1 100.0 %
Total services revenues 1,280 1,023 257 25.1 %
Intersegment revenues:
Pharmacy solutions 13,079 11,352 1,727 15.2 %
Provider services 1,080 370 710 191.9 %
Home based services 326 167 159 95.2 %
Integrated behavioral health services 126 133 (7) (5.3)%
Total intersegment revenues 14,611 12,022 2,589 21.5 %
Total services and intersegment revenues $ 15,891 $ 13,045 $ 2,846 21.8 %
Income before income taxes $ 521 $ 428 $ 93 21.7 %
Operating cost ratio 95.8% 96.1% (0.3)%
Pretax results
• Healthcare Services segment pretax income of $521 million for 2013 increased $93 million from 2012 as
revenue growth and the pretax income contribution from our home based services and pharmacy solutions
businesses, as well as the acquisition of Metropolitan, were partially offset by previously-planned investment
spending associated with the integration and build-out of provider practices. The growth in pretax income
associated with our home based services business reflects the increase in home health services provided to
our Medicare Advantage members.
Script Volume
• Humana Pharmacy Solutions® script volumes for the Retail and Employer Group segment membership
increased to approximately 274 million in 2013, up 15% versus scripts of approximately 238 million in 2012.