Humana 2014 Annual Report Download - page 79
Download and view the complete annual report
Please find page 79 of the 2014 Humana annual report below. You can navigate through the pages in the report by either clicking on the pages listed below, or by using the keyword search tool below to find specific information within the annual report.-
 1
1 -
2
-
3
-
4
-
5
-
6
-
7
-
8
-
9
-
10
-
11
-
12
-
13
-
14
-
15
-
16
-
17
-
18
-
19
-
20
-
21
-
22
-
23
-
24
-
25
-
26
-
27
-
28
-
29
-
30
-
31
-
32
-
33
-
34
-
35
-
36
-
37
-
38
-
39
-
40
-
41
-
42
-
43
-
44
-
45
-
46
-
47
-
48
-
49
-
50
-
51
-
52
-
53
-
54
-
55
-
56
-
57
-
58
-
59
-
60
-
61
-
62
-
63
-
64
-
65
-
66
-
67
-
68
-
 69
69 -
 70
70 -
 71
71 -
 72
72 -
 73
73 -
 74
74 -
 75
75 -
 76
76 -
 77
77 -
 78
78 -
 79
79 -
 80
80 -
 81
81 -
 82
82 -
 83
83 -
 84
84 -
 85
85 -
 86
86 -
 87
87 -
 88
88 -
 89
89 -
90
-
91
-
92
-
93
-
94
-
95
-
96
-
97
-
98
-
99
-
100
-
101
-
102
-
103
-
104
-
105
-
106
-
107
-
108
-
109
-
110
-
111
-
112
-
113
-
114
-
115
-
116
-
117
-
118
-
119
-
120
-
121
-
122
-
123
-
124
-
125
-
126
-
127
-
128
-
129
-
130
-
131
-
132
-
133
-
134
-
135
-
136
-
137
-
138
-
139
-
140
-
141
-
142
-
143
-
144
-
145
-
146
-
147
-
148
-
149
-
150
-
151
-
152
-
153
-
154
-
155
-
156
-
157
-
158
 |
 |

71
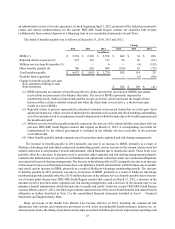
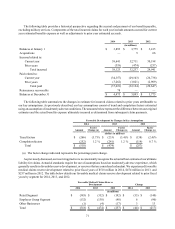
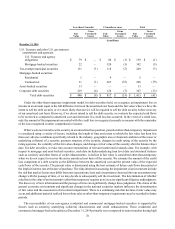
The following table provides a historical perspective regarding the accrual and payment of our benefits payable,
excluding military services. Components of the total incurred claims for each year include amounts accrued for current
year estimated benefits expense as well as adjustments to prior year estimated accruals.
2014 2013 2012
(in millions)
Balances at January 1 $ 3,893 $ 3,775 $ 3,415
Acquisitions — 5 66
Incurred related to:
Current year 38,641 32,711 30,198
Prior years (518)(474)(257)
Total incurred 38,123 32,237 29,941
Paid related to:
Current year (34,357)(29,103)(26,738)
Prior years (3,262)(3,021)(2,909)
Total paid (37,619)(32,124)(29,647)
Reinsurance recoverable 78 — —
Balances at December 31 $ 4,475 $ 3,893 $ 3,775
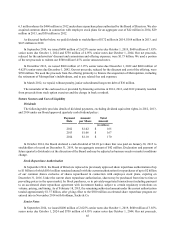
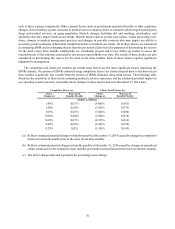
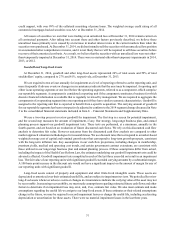
The following table summarizes the changes in estimate for incurred claims related to prior years attributable to
our key assumptions. As previously described, our key assumptions consist of trend and completion factors estimated
using an assumption of moderately adverse conditions. The amounts below represent the difference between our original
estimates and the actual benefits expense ultimately incurred as determined from subsequent claim payments.
Favorable Development by Changes in Key Assumptions
2014 2013 2012
Amount
Factor
Change (a) Amount
Factor
Change (a) Amount
Factor
Change (a)
(dollars in millions)
Trend factors $ (266) (3.7)% $ (233) (3.4)% $ (138) (2.4)%
Completion factors (252) 1.2 % (241) 1.2 % (119) 0.7 %
Total $ (518) $ (474)$
(257)
(a) The factor change indicated represents the percentage point change.
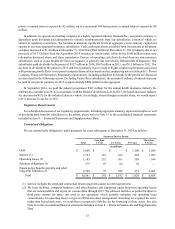
As previously discussed, our reserving practice is to consistently recognize the actuarial best estimate of our ultimate
liability for claims. Actuarial standards require the use of assumptions based on moderately adverse experience, which
generally results in favorable reserve development, or reserves that are considered redundant. We experienced favorable
medical claims reserve development related to prior fiscal years of $518 million in 2014, $474 million in 2013, and
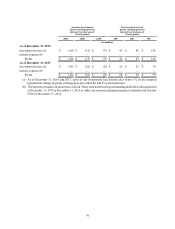
$257 million in 2012. The table below details our favorable medical claims reserve development related to prior fiscal
years by segment for 2014, 2013, and 2012.
Favorable Medical Claims Reserve
Development Change
2014 2013 2012 2014 2013
(in millions)
Retail Segment $ (385) $ (332)$ (192)$ (53)$ (140)
Employer Group Segment (132) (138)(48)6
(90)
Other Businesses (1) (4)(17)313
Total $ (518) $ (474)$ (257)$ (44)$ (217)