Humana 2014 Annual Report Download - page 130
Download and view the complete annual report
Please find page 130 of the 2014 Humana annual report below. You can navigate through the pages in the report by either clicking on the pages listed below, or by using the keyword search tool below to find specific information within the annual report.-
 1
1 -
2
-
3
-
4
-
5
-
6
-
7
-
8
-
9
-
10
-
11
-
12
-
13
-
14
-
15
-
16
-
17
-
18
-
19
-
20
-
21
-
22
-
23
-
24
-
25
-
26
-
27
-
28
-
29
-
30
-
31
-
32
-
33
-
34
-
35
-
36
-
37
-
38
-
39
-
40
-
41
-
42
-
43
-
44
-
45
-
46
-
47
-
48
-
49
-
50
-
51
-
52
-
53
-
54
-
55
-
56
-
57
-
58
-
59
-
60
-
61
-
62
-
63
-
64
-
65
-
66
-
67
-
68
-
69
-
70
-
71
-
72
-
73
-
74
-
75
-
76
-
77
-
78
-
79
-
80
-
81
-
82
-
83
-
84
-
85
-
86
-
87
-
88
-
89
-
90
-
91
-
92
-
93
-
94
-
95
-
96
-
97
-
98
-
99
-
100
-
101
-
102
-
103
-
104
-
105
-
106
-
107
-
108
-
109
-
110
-
111
-
112
-
113
-
114
-
115
-
116
-
117
-
118
-
119
-
 120
120 -
 121
121 -
 122
122 -
 123
123 -
 124
124 -
 125
125 -
 126
126 -
 127
127 -
 128
128 -
 129
129 -
 130
130 -
 131
131 -
 132
132 -
 133
133 -
 134
134 -
 135
135 -
 136
136 -
 137
137 -
 138
138 -
 139
139 -
 140
140 -
141
-
142
-
143
-
144
-
145
-
146
-
147
-
148
-
149
-
150
-
151
-
152
-
153
-
154
-
155
-
156
-
157
-
158
 |
 |

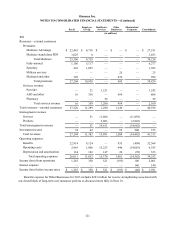
Humana Inc.
NOTES TO CONSOLIDATED FINANCIAL STATEMENTS—(Continued)
122
Retail
Employer
Group
Healthcare
Services
Other
Businesses
Eliminations/
Corporate Consolidated
(in millions)
2012
Revenues—external customers
Premiums:
Medicare Advantage $ 20,788 $ 4,064 $ — $ — $ — $ 24,852
Medicare stand-alone PDP 2,853 8 — — — 2,861
Total Medicare 23,641 4,072 — — — 27,713
Fully-insured 1,004 4,996 — — — 6,000
Specialty 171 1,070 — — — 1,241
Military services — — — 1,017 — 1,017
Medicaid and other 185 — — 853 — 1,038
Total premiums 25,001 10,138 — 1,870 — 37,009
Services revenue:
Provider — 13 1,007 — — 1,020
ASO and other 24 358 — 308 — 690
Pharmacy ——16— — 16
Total services revenue 24 371 1,023 308 — 1,726
Total revenues—external customers 25,025 10,509 1,023 2,178 — 38,735
Intersegment revenues
Services 2 31 9,680 — (9,713)—
Products — — 2,342 — (2,342)—
Total intersegment revenues 2 31 12,022 — (12,055)—
Investment income 79 42 — 58 212 391
Total revenues 25,106 10,582 13,045 2,236 (11,843) 39,126
Operating expenses:
Benefits 21,048 8,471 — 1,802 (336) 30,985
Operating costs 2,767 1,710 12,530 436 (11,613) 5,830
Depreciation and amortization 130 89 87 16 (27) 295
Total operating expenses 23,945 10,270 12,617 2,254 (11,976) 37,110
Income (loss) from operations 1,161 312 428 (18) 133 2,016
Interest expense ———— 105 105
Income (loss) before income taxes $ 1,161 $ 312 $ 428 $ (18) $ 28 $ 1,911
18. EXPENSES ASSOCIATED WITH LONG-DURATION INSURANCE PRODUCTS
Premiums associated with our long-duration insurance products accounted for approximately 2% of our
consolidated premiums and services revenue for the year ended December 31, 2014. We use long-duration accounting
for products such as long-term care, life insurance, annuities, and certain health and other supplemental policies sold
to individuals because they are expected to remain in force for an extended period beyond one year and because premium
received in the earlier years is intended to pay anticipated benefits to be incurred in future years. As a result, we defer
policy acquisition costs, primarily consisting of commissions, and amortize them over the estimated life of the policies
in proportion to premiums earned.