Humana 2014 Annual Report Download - page 91
Download and view the complete annual report
Please find page 91 of the 2014 Humana annual report below. You can navigate through the pages in the report by either clicking on the pages listed below, or by using the keyword search tool below to find specific information within the annual report.-
 1
1 -
2
-
3
-
4
-
5
-
6
-
7
-
8
-
9
-
10
-
11
-
12
-
13
-
14
-
15
-
16
-
17
-
18
-
19
-
20
-
21
-
22
-
23
-
24
-
25
-
26
-
27
-
28
-
29
-
30
-
31
-
32
-
33
-
34
-
35
-
36
-
37
-
38
-
39
-
40
-
41
-
42
-
43
-
44
-
45
-
46
-
47
-
48
-
49
-
50
-
51
-
52
-
53
-
54
-
55
-
56
-
57
-
58
-
59
-
60
-
61
-
62
-
63
-
64
-
65
-
66
-
67
-
68
-
69
-
70
-
71
-
72
-
73
-
74
-
75
-
76
-
77
-
78
-
79
-
80
-
 81
81 -
 82
82 -
 83
83 -
 84
84 -
 85
85 -
 86
86 -
 87
87 -
 88
88 -
 89
89 -
 90
90 -
 91
91 -
 92
92 -
 93
93 -
 94
94 -
 95
95 -
 96
96 -
 97
97 -
 98
98 -
 99
99 -
 100
100 -
 101
101 -
102
-
103
-
104
-
105
-
106
-
107
-
108
-
109
-
110
-
111
-
112
-
113
-
114
-
115
-
116
-
117
-
118
-
119
-
120
-
121
-
122
-
123
-
124
-
125
-
126
-
127
-
128
-
129
-
130
-
131
-
132
-
133
-
134
-
135
-
136
-
137
-
138
-
139
-
140
-
141
-
142
-
143
-
144
-
145
-
146
-
147
-
148
-
149
-
150
-
151
-
152
-
153
-
154
-
155
-
156
-
157
-
158
 |
 |

83
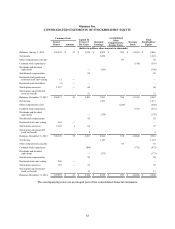
Humana Inc.
CONSOLIDATED STATEMENTS OF STOCKHOLDERS’ EQUITY
Common Stock Capital In
Excess of
Par Value
Retained
Earnings
Accumulated
Other
Comprehensive
Income (Loss)
Treasury
Stock
Total
Stockholders’
Equity
Issued
Shares Amount
(dollars in millions, share amounts in thousands)
Balances, January 1, 2012 193,230 $ 32 $ 1,938 $ 6,825 $ 303 $ (1,035) $ 8,063
Net income 1,222 1,222
Other comprehensive income 83 83
Common stock repurchases (518) (518)
Dividends and dividend
equivalents — (166) (166)
Stock-based compensation 82 82
Restricted stock grants and
restricted stock unit vesting 15 — —
Restricted stock forfeitures (1) — — —
Stock option exercises 1,227 — 60 60
Stock option and restricted
stock tax benefit 21 21
Balances, December 31, 2012 194,471 32 2,101 7,881 386 (1,553) 8,847
Net income 1,231 1,231
Other comprehensive loss (228) (228)
Common stock repurchases (531) (531)
Dividends and dividend
equivalents — (170) (170)
Stock-based compensation 92 92
Restricted stock unit vesting 563 — —
Stock option exercises 1,242 1 66 67
Stock option and restricted
stock tax benefit 8 8
Balances, December 31, 2013 196,276 33 2,267 8,942 158 (2,084) 9,316
Net income 1,147 1,147
Other comprehensive income 65 65
Common stock repurchases (100) (772) (872)
Dividends and dividend
equivalents — (173) (173)
Stock-based compensation 98 98
Restricted stock unit vesting 966 — —
Stock option exercises 710 — 52 52
Stock option and restricted
stock tax benefit 13 13
Balances, December 31, 2014 197,952 $ 33 $ 2,330 $ 9,916 $ 223 $ (2,856) $ 9,646
The accompanying notes are an integral part of the consolidated financial statements.