Humana 2014 Annual Report Download - page 55
Download and view the complete annual report
Please find page 55 of the 2014 Humana annual report below. You can navigate through the pages in the report by either clicking on the pages listed below, or by using the keyword search tool below to find specific information within the annual report.-
 1
1 -
2
-
3
-
4
-
5
-
6
-
7
-
8
-
9
-
10
-
11
-
12
-
13
-
14
-
15
-
16
-
17
-
18
-
19
-
20
-
21
-
22
-
23
-
24
-
25
-
26
-
27
-
28
-
29
-
30
-
31
-
32
-
33
-
34
-
35
-
36
-
37
-
38
-
39
-
40
-
41
-
42
-
43
-
44
-
 45
45 -
 46
46 -
 47
47 -
 48
48 -
 49
49 -
 50
50 -
 51
51 -
 52
52 -
 53
53 -
 54
54 -
 55
55 -
 56
56 -
 57
57 -
 58
58 -
 59
59 -
 60
60 -
 61
61 -
 62
62 -
 63
63 -
 64
64 -
 65
65 -
66
-
67
-
68
-
69
-
70
-
71
-
72
-
73
-
74
-
75
-
76
-
77
-
78
-
79
-
80
-
81
-
82
-
83
-
84
-
85
-
86
-
87
-
88
-
89
-
90
-
91
-
92
-
93
-
94
-
95
-
96
-
97
-
98
-
99
-
100
-
101
-
102
-
103
-
104
-
105
-
106
-
107
-
108
-
109
-
110
-
111
-
112
-
113
-
114
-
115
-
116
-
117
-
118
-
119
-
120
-
121
-
122
-
123
-
124
-
125
-
126
-
127
-
128
-
129
-
130
-
131
-
132
-
133
-
134
-
135
-
136
-
137
-
138
-
139
-
140
-
141
-
142
-
143
-
144
-
145
-
146
-
147
-
148
-
149
-
150
-
151
-
152
-
153
-
154
-
155
-
156
-
157
-
158
 |
 |
47
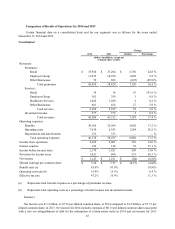
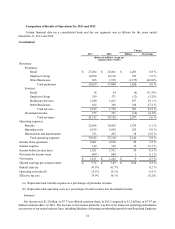
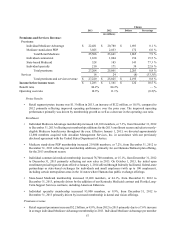
Operating Costs
Our segments incur both direct and shared indirect operating costs. We allocate the indirect costs shared by the
segments primarily as a function of revenues. As a result, the profitability of each segment is interdependent.
Consolidated operating costs increased $1,284 million, or 20.2%, in 2014 compared to 2013 primarily due to costs
mandated by the Health Care Reform Law, including the non-deductible health insurance industry fee, and investments
in health care exchanges and state-based contracts, partially offset by operating cost efficiencies.
The consolidated operating cost ratio for 2014 was 15.9%, increasing 40 basis points from 2013 primarily due to
increases in the operating cost ratios in our Retail and Employer Group segments due to the same factors impacting
consolidated operating costs as described above.
Depreciation and Amortization
Depreciation and amortization for 2014 totaled $333 million, unchanged from 2013.
Interest Expense
Interest expense was $192 million for 2014 compared to $140 million for 2013, an increase of $52 million, or
37.1%. In September 2014, we issued $400 million of 2.625% senior notes due October 1, 2019, $600 million of 3.85%
senior notes due October 1, 2024 and $750 million of 4.95% senior notes due October 1, 2044. In October 2014, we
redeemed the $500 million 6.45% senior unsecured notes due June 1, 2016, at 100% of the principal amount plus
applicable premium for early redemption and accrued and unpaid interest to the redemption date. We recognized a loss
on extinguishment of debt, included in interest expense, of approximately $37 million in connection with the redemption
of these notes.
Income Taxes
Our effective tax rate during 2014 was 47.2% compared to the effective tax rate of 35.9% in 2013. The non-
deductible nature of the health insurance industry fee levied on the insurance industry beginning in 2014 as mandated
by the Health Care Reform Law increased our effective tax rate by approximately 9.4 percentage points for 2014. See
Note 11 to the consolidated financial statements included in Item 8. – Financial Statements and Supplementary Data
for a complete reconciliation of the federal statutory rate to the effective tax rate.