Humana 2014 Annual Report Download - page 54
Download and view the complete annual report
Please find page 54 of the 2014 Humana annual report below. You can navigate through the pages in the report by either clicking on the pages listed below, or by using the keyword search tool below to find specific information within the annual report.-
 1
1 -
2
-
3
-
4
-
5
-
6
-
7
-
8
-
9
-
10
-
11
-
12
-
13
-
14
-
15
-
16
-
17
-
18
-
19
-
20
-
21
-
22
-
23
-
24
-
25
-
26
-
27
-
28
-
29
-
30
-
31
-
32
-
33
-
34
-
35
-
36
-
37
-
38
-
39
-
40
-
41
-
42
-
43
-
 44
44 -
 45
45 -
 46
46 -
 47
47 -
 48
48 -
 49
49 -
 50
50 -
 51
51 -
 52
52 -
 53
53 -
 54
54 -
 55
55 -
 56
56 -
 57
57 -
 58
58 -
 59
59 -
 60
60 -
 61
61 -
 62
62 -
 63
63 -
 64
64 -
65
-
66
-
67
-
68
-
69
-
70
-
71
-
72
-
73
-
74
-
75
-
76
-
77
-
78
-
79
-
80
-
81
-
82
-
83
-
84
-
85
-
86
-
87
-
88
-
89
-
90
-
91
-
92
-
93
-
94
-
95
-
96
-
97
-
98
-
99
-
100
-
101
-
102
-
103
-
104
-
105
-
106
-
107
-
108
-
109
-
110
-
111
-
112
-
113
-
114
-
115
-
116
-
117
-
118
-
119
-
120
-
121
-
122
-
123
-
124
-
125
-
126
-
127
-
128
-
129
-
130
-
131
-
132
-
133
-
134
-
135
-
136
-
137
-
138
-
139
-
140
-
141
-
142
-
143
-
144
-
145
-
146
-
147
-
148
-
149
-
150
-
151
-
152
-
153
-
154
-
155
-
156
-
157
-
158
 |
 |
46
includes benefits expense of $0.99 per diluted common share for reserve strengthening associated with our closed-
block of long-term care insurance policies included with Other Businesses as discussed in Note 18 to the consolidated
financial statements included in Item 8. – Financial Statements and Supplementary Data as well as the benefit of a
reduction in benefits expense in 2013 related to a favorable settlement of contract claims with the DoD. Excluding
these items, the increase in net income primarily resulted from higher pretax income in our Healthcare Services segment
substantially offset by lower pretax income in our Retail and Employer Group segments. In addition, 2014 was favorably
impacted by a lower number of shares used to compute diluted earnings per common share reflecting the impact of
share repurchases.
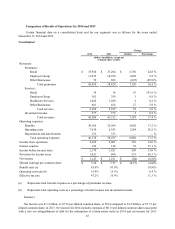
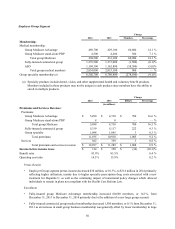
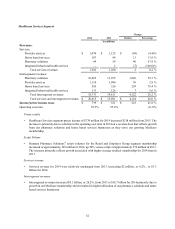
Premiums Revenue
Consolidated premiums increased $7.1 billion, or 18.4%, from 2013 to $46.0 billion for 2014 primarily due to
increases in both Retail and Employer Group segment premiums mainly driven by higher average individual and group
Medicare Advantage membership as well as higher individual commercial medical membership. In addition, year-over-
year comparisons to the 2013 were negatively impacted by sequestration which became effective April 1, 2013.
Premiums revenue for our Other Businesses declined primarily due to the loss of our Puerto Rico Medicaid contracts
effective September 30, 2013. Average membership is calculated by summing the ending membership for each month
in a period and dividing the result by the number of months in a period. Premiums revenue reflects changes in membership
and average per member premiums. Items impacting average per member premiums include changes in premium rates
as well as changes in the geographic mix of membership, the mix of product offerings, and the mix of benefit plans
selected by our membership.
Services Revenue
Consolidated services revenue increased $55 million, or 2.6%, from 2013 to $2.2 billion for 2014 primarily due
to an increase in services revenue in our Retail segment due to the acquisition of American Eldercare in September
2013.
Investment Income
Investment income totaled $377 million for 2014, an increase of $2 million from 2013, as higher average invested
balances were partially offset by lower interest rates.
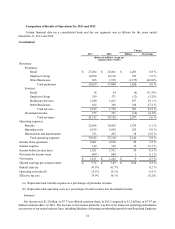
Benefits Expense
Consolidated benefits expense was $38.2 billion for 2014, an increase of $5.6 billion, or 17.2%, from 2013 primarily
due to increases in both the Retail and Employer Group segments mainly driven by higher average individual and group
Medicare Advantage membership as well as higher individual commercial medical membership. As more fully described
herein under the section entitled “Benefits Expense Recognition”, actuarial standards require the use of assumptions
based on moderately adverse experience, which generally results in favorable reserve development, or reserves that
are considered redundant. We experienced favorable medical claims reserve development related to prior fiscal years
of $518 million in 2014 and $474 million in 2013. These increases in favorable medical claims reserve development
primarily resulted from increased membership and better than originally expected utilization across most of our major
business lines and increased financial recoveries. The increase in financial recoveries primarily resulted from claim
audit process enhancements as well as increased volume of claim audits and expanded audit scope. All lines of business
benefited from these improvements.
The consolidated benefit ratio for 2014 was 83.0%, a decrease of 90 basis points from 2013 primarily due to reserve
strengthening in 2013 associated with our closed-block of long-term care insurance policies included with Other
Businesses as discussed above, as well as the loss of our Medicaid contracts in Puerto Rico effective September 30,
2013 which more than offset higher ratios year-over-year in the Retail and Employer Group segments.