Humana 2014 Annual Report Download - page 49
Download and view the complete annual report
Please find page 49 of the 2014 Humana annual report below. You can navigate through the pages in the report by either clicking on the pages listed below, or by using the keyword search tool below to find specific information within the annual report.-
 1
1 -
2
-
3
-
4
-
5
-
6
-
7
-
8
-
9
-
10
-
11
-
12
-
13
-
14
-
15
-
16
-
17
-
18
-
19
-
20
-
21
-
22
-
23
-
24
-
25
-
26
-
27
-
28
-
29
-
30
-
31
-
32
-
33
-
34
-
35
-
36
-
37
-
38
-
 39
39 -
 40
40 -
 41
41 -
 42
42 -
 43
43 -
 44
44 -
 45
45 -
 46
46 -
 47
47 -
 48
48 -
 49
49 -
 50
50 -
 51
51 -
 52
52 -
 53
53 -
 54
54 -
 55
55 -
 56
56 -
 57
57 -
 58
58 -
 59
59 -
60
-
61
-
62
-
63
-
64
-
65
-
66
-
67
-
68
-
69
-
70
-
71
-
72
-
73
-
74
-
75
-
76
-
77
-
78
-
79
-
80
-
81
-
82
-
83
-
84
-
85
-
86
-
87
-
88
-
89
-
90
-
91
-
92
-
93
-
94
-
95
-
96
-
97
-
98
-
99
-
100
-
101
-
102
-
103
-
104
-
105
-
106
-
107
-
108
-
109
-
110
-
111
-
112
-
113
-
114
-
115
-
116
-
117
-
118
-
119
-
120
-
121
-
122
-
123
-
124
-
125
-
126
-
127
-
128
-
129
-
130
-
131
-
132
-
133
-
134
-
135
-
136
-
137
-
138
-
139
-
140
-
141
-
142
-
143
-
144
-
145
-
146
-
147
-
148
-
149
-
150
-
151
-
152
-
153
-
154
-
155
-
156
-
157
-
158
 |
 |
41
• Year-over-year comparisons of diluted earnings per common share are favorably impacted by a lower number
of shares used to compute diluted earnings per common share reflecting the impact of share repurchases.
• Our operating cash flow of $1.6 billion for the year ended December 31, 2014 compared to operating cash
flow of $1.7 billion for the year ended December 31, 2013. For 2014, the effect of the commercial risk
adjustment, risk corridor, and reinsurance provisions of the Health Care Reform Law impacted the timing of
our operating cash flows, as we built a receivable of $679 million in 2014 that is expected to be collected in
2015.
• Our 2014 financing cash flows have been negatively impacted by the timing of payments to and receipts from
CMS associated with Medicare Part D reinsurance subsidies for which we do not assume risk. Claims payments
were $945 million higher than receipts from CMS associated with Medicare Part D claim subsidies for which
we do not assume risk during 2014. We are experiencing higher specialty prescription drug costs associated
with a new treatment for Hepatitis C than were contemplated in our bids which is resulting in higher reinsurance
subsidy receivable balances in 2014 that will be settled in 2015 under the terms of our contracts with CMS.
• We continue to focus on disciplined capital allocation. In 2014, we issued senior notes and received net
proceeds of $1.7 billion, redeemed our $500 million 6.45% senior notes for cash totaling approximately $560
million, repurchased 5.7 million shares of our common stock for $730 million in open market transactions
(which excludes another $100 million of stock held back pursuant to an accelerated share repurchase program),
and paid dividends to stockholders of $172 million.
Retail Segment
• On April 7, 2014, CMS announced final 2015 Medicare benchmark payment rates and related technical factors
impacting the bid benchmark premiums, which we refer to as the Final Rate Notice. We believe the Final Rate
Notices together with the impact of payment cuts associated with the Health Care Reform Law, quality bonuses,
sunset of the Star quality CMS demonstration in 2015, risk coding modifications, the impact of the health
insurance industry fee, and other funding formula changes, indicate 2015 Medicare Advantage funding cuts
of approximately 2%. We believe we have effectively designed Medicare Advantage products based upon
these levels of rate reduction while continuing to remain competitive compared to both the combination of
Medicare FFS with a supplement policy as well as Medicare Advantage products offered by our
competitors. Failure to execute these strategies may result in a material adverse effect on our results of
operations, financial position, and cash flows.
• Medicare Advantage premiums are tied to the achievement of certain quality performance measures (Star
Ratings). Beginning in 2015, plans must have a Star Rating of four or higher to qualify for bonus money. Star
Ratings issued by CMS in October 2014 indicated that plans covering 92% of our Medicare Advantage
membership for the 2015 plan year achieved a Star Rating of 4.0 or higher. We have 23 Medicare Advantage
plans that achieved a rating of four or more stars, an increase from 18 the previous year. We are offering one
Medicare Advantage plan that achieved a 5.0 Star Rating, our CarePlus Health Plans, Inc. HMO plan in Florida,
as well as five Medicare Advantage plans that achieved a 4.5 Star Rating. Plans that earn an overall Star Rating
of five become eligible to enroll members year round.
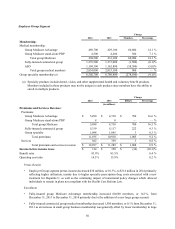
• As discussed in the detailed Retail segment results of operations discussion that follows, for the year ended
December 31, 2014, our Retail segment pretax income declined by 14.4% primarily due to the same factors
discussed above for our consolidated results.
• Individual Medicare Advantage membership increased 377,500 members, or 18.2%, from December 31, 2013
to December 31, 2014 reflecting net membership additions, particularly for our HMO offerings, for the 2014
plan year as well as dual eligible members from state-based contracts in Virginia and Illinois. January 1, 2015
individual Medicare Advantage membership increased approximately 257,000 members, or 10.5%, from
December 31, 2014 reflecting net membership additions for the 2015 enrollment season, primarily in our HMO
offerings.