Humana 2014 Annual Report Download - page 60
Download and view the complete annual report
Please find page 60 of the 2014 Humana annual report below. You can navigate through the pages in the report by either clicking on the pages listed below, or by using the keyword search tool below to find specific information within the annual report.-
 1
1 -
2
-
3
-
4
-
5
-
6
-
7
-
8
-
9
-
10
-
11
-
12
-
13
-
14
-
15
-
16
-
17
-
18
-
19
-
20
-
21
-
22
-
23
-
24
-
25
-
26
-
27
-
28
-
29
-
30
-
31
-
32
-
33
-
34
-
35
-
36
-
37
-
38
-
39
-
40
-
41
-
42
-
43
-
44
-
45
-
46
-
47
-
48
-
49
-
 50
50 -
 51
51 -
 52
52 -
 53
53 -
 54
54 -
 55
55 -
 56
56 -
 57
57 -
 58
58 -
 59
59 -
 60
60 -
 61
61 -
 62
62 -
 63
63 -
 64
64 -
 65
65 -
 66
66 -
 67
67 -
 68
68 -
 69
69 -
 70
70 -
71
-
72
-
73
-
74
-
75
-
76
-
77
-
78
-
79
-
80
-
81
-
82
-
83
-
84
-
85
-
86
-
87
-
88
-
89
-
90
-
91
-
92
-
93
-
94
-
95
-
96
-
97
-
98
-
99
-
100
-
101
-
102
-
103
-
104
-
105
-
106
-
107
-
108
-
109
-
110
-
111
-
112
-
113
-
114
-
115
-
116
-
117
-
118
-
119
-
120
-
121
-
122
-
123
-
124
-
125
-
126
-
127
-
128
-
129
-
130
-
131
-
132
-
133
-
134
-
135
-
136
-
137
-
138
-
139
-
140
-
141
-
142
-
143
-
144
-
145
-
146
-
147
-
148
-
149
-
150
-
151
-
152
-
153
-
154
-
155
-
156
-
157
-
158
 |
 |

52
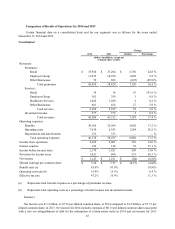
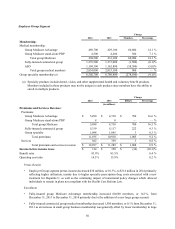
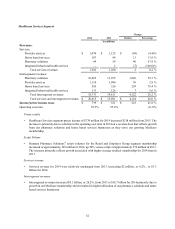
Healthcare Services Segment
Change
2014 2013 Dollars Percentage
(in millions)
Revenues:
Services:
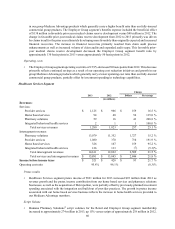
Provider services $ 1,076 $ 1,125 $ (49) (4.4)%
Home based services 107 94 13 13.8 %
Pharmacy solutions 99 59 40 67.8 %
Integrated behavioral health services — 2 (2) (100.0)%
Total services revenues 1,282 1,280 2 0.2 %
Intersegment revenues:
Pharmacy solutions 16,905 13,079 3,826 29.3 %
Provider services 1,110 1,080 30 2.8 %
Home based services 585 326 259 79.4 %
Integrated behavioral health services 133 126 7 5.6 %
Total intersegment revenues 18,733 14,611 4,122 28.2 %
Total services and intersegment revenues $ 20,015 $ 15,891 $ 4,124 26.0 %
Income before income taxes $ 739 $ 521 $ 218 41.8 %
Operating cost ratio 95.5% 95.8% (0.3)%
Pretax results
• Healthcare Services segment pretax income of $739 million for 2014 increased $218 million from 2013. The
increase is primarily due to a decline in the operating cost ratio in 2014 on a revenue base that reflects growth
from our pharmacy solutions and home based services businesses as they serve our growing Medicare
membership.
Script Volume
• Humana Pharmacy Solutions® script volumes for the Retail and Employer Group segment membership
increased to approximately 329 million in 2014, up 20% versus scripts of approximately 274 million in 2013.
The increase primarily reflects growth associated with higher average medical membership for 2014 than in
2013.
Services revenue
• Services revenue for 2014 were relatively unchanged from 2013, increasing $2 million, or 0.2% , to $1.3
billion for 2014.
Intersegment revenues
• Intersegment revenues increased $4.1 billion, or 28.2%, from 2013 to $18.7 billion for 2014 primarily due to
growth in our Medicare membership which resulted in higher utilization of our pharmacy solutions and home
based services businesses.