Humana 2014 Annual Report Download - page 92
Download and view the complete annual report
Please find page 92 of the 2014 Humana annual report below. You can navigate through the pages in the report by either clicking on the pages listed below, or by using the keyword search tool below to find specific information within the annual report.-
 1
1 -
2
-
3
-
4
-
5
-
6
-
7
-
8
-
9
-
10
-
11
-
12
-
13
-
14
-
15
-
16
-
17
-
18
-
19
-
20
-
21
-
22
-
23
-
24
-
25
-
26
-
27
-
28
-
29
-
30
-
31
-
32
-
33
-
34
-
35
-
36
-
37
-
38
-
39
-
40
-
41
-
42
-
43
-
44
-
45
-
46
-
47
-
48
-
49
-
50
-
51
-
52
-
53
-
54
-
55
-
56
-
57
-
58
-
59
-
60
-
61
-
62
-
63
-
64
-
65
-
66
-
67
-
68
-
69
-
70
-
71
-
72
-
73
-
74
-
75
-
76
-
77
-
78
-
79
-
80
-
81
-
 82
82 -
 83
83 -
 84
84 -
 85
85 -
 86
86 -
 87
87 -
 88
88 -
 89
89 -
 90
90 -
 91
91 -
 92
92 -
 93
93 -
 94
94 -
 95
95 -
 96
96 -
 97
97 -
 98
98 -
 99
99 -
 100
100 -
 101
101 -
 102
102 -
103
-
104
-
105
-
106
-
107
-
108
-
109
-
110
-
111
-
112
-
113
-
114
-
115
-
116
-
117
-
118
-
119
-
120
-
121
-
122
-
123
-
124
-
125
-
126
-
127
-
128
-
129
-
130
-
131
-
132
-
133
-
134
-
135
-
136
-
137
-
138
-
139
-
140
-
141
-
142
-
143
-
144
-
145
-
146
-
147
-
148
-
149
-
150
-
151
-
152
-
153
-
154
-
155
-
156
-
157
-
158
 |
 |

84
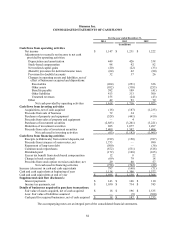
Humana Inc.
CONSOLIDATED STATEMENTS OF CASH FLOWS
For the year ended December 31,
2014 2013 2012
(in millions)
Cash flows from operating activities
Net income $ 1,147 $ 1,231 $ 1,222
Adjustments to reconcile net income to net cash
provided by operating activities:
Depreciation and amortization 449 426 338
Stock-based compensation 98 92 82
Net realized capital gains (20) (22) (33)
(Benefit) provision for deferred income taxes (64) 42 (80)
Provision for doubtful accounts 32 37 26
Changes in operating assets and liabilities, net of
effect of businesses acquired and dispositions:
Receivables (264) (251) 326
Other assets (952) (330) (253)
Benefits payable 582 109 (41)
Other liabilities 413 313 300
Unearned revenues 155 (24) (43)
Other 42 93 79
Net cash provided by operating activities 1,618 1,716 1,923
Cash flows from investing activities
Acquisitions, net of cash acquired (18) (187) (1,235)
Proceeds from sale of business 72 34 —
Purchases of property and equipment (528) (441) (410)
Proceeds from sales of property and equipment — 4 —
Purchases of investment securities (2,883) (3,261) (3,221)
Maturities of investment securities 885 1,077 1,497
Proceeds from sales of investment securities 2,409 1,592 1,404
Net cash used in investing activities (63) (1,182) (1,965)
Cash flows from financing activities
Receipts (withdrawals) from contract deposits, net (919) (150) (397)
Proceeds from issuance of senior notes, net 1,733 — 990
Repayment of long-term debt (500) — (36)
Common stock repurchases (872) (531) (518)
Dividends paid (172) (168) (165)
Excess tax benefit from stock-based compensation 12 8 22
Change in book overdraft (69) 79 18
Proceeds from stock option exercises and other, net 29 60 57
Net cash used in financing activities (758) (702) (29)
Increase (decrease) in cash and cash equivalents 797 (168) (71)
Cash and cash equivalents at beginning of year 1,138 1,306 1,377
Cash and cash equivalents at end of year $ 1,935 $ 1,138 $ 1,306
Supplemental cash flow disclosures:
Interest payments $ 143 $ 146 $ 110
Income tax payments, net $ 1,030 $ 734 $ 745
Details of businesses acquired in purchase transactions:
Fair value of assets acquired, net of cash acquired $ 18 $ 196 $ 1,535
Less: Fair value of liabilities assumed — (9) (300)
Cash paid for acquired businesses, net of cash acquired $ 18 $ 187 $ 1,235
The accompanying notes are an integral part of the consolidated financial statements.