Humana 2014 Annual Report Download - page 112
Download and view the complete annual report
Please find page 112 of the 2014 Humana annual report below. You can navigate through the pages in the report by either clicking on the pages listed below, or by using the keyword search tool below to find specific information within the annual report.-
 1
1 -
2
-
3
-
4
-
5
-
6
-
7
-
8
-
9
-
10
-
11
-
12
-
13
-
14
-
15
-
16
-
17
-
18
-
19
-
20
-
21
-
22
-
23
-
24
-
25
-
26
-
27
-
28
-
29
-
30
-
31
-
32
-
33
-
34
-
35
-
36
-
37
-
38
-
39
-
40
-
41
-
42
-
43
-
44
-
45
-
46
-
47
-
48
-
49
-
50
-
51
-
52
-
53
-
54
-
55
-
56
-
57
-
58
-
59
-
60
-
61
-
62
-
63
-
64
-
65
-
66
-
67
-
68
-
69
-
70
-
71
-
72
-
73
-
74
-
75
-
76
-
77
-
78
-
79
-
80
-
81
-
82
-
83
-
84
-
85
-
86
-
87
-
88
-
89
-
90
-
91
-
92
-
93
-
94
-
95
-
96
-
97
-
98
-
99
-
100
-
101
-
 102
102 -
 103
103 -
 104
104 -
 105
105 -
 106
106 -
 107
107 -
 108
108 -
 109
109 -
 110
110 -
 111
111 -
 112
112 -
 113
113 -
 114
114 -
 115
115 -
 116
116 -
 117
117 -
 118
118 -
 119
119 -
 120
120 -
 121
121 -
 122
122 -
123
-
124
-
125
-
126
-
127
-
128
-
129
-
130
-
131
-
132
-
133
-
134
-
135
-
136
-
137
-
138
-
139
-
140
-
141
-
142
-
143
-
144
-
145
-
146
-
147
-
148
-
149
-
150
-
151
-
152
-
153
-
154
-
155
-
156
-
157
-
158
 |
 |

Humana Inc.
NOTES TO CONSOLIDATED FINANCIAL STATEMENTS—(Continued)
104
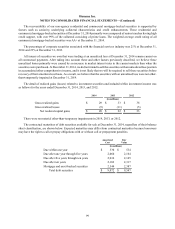
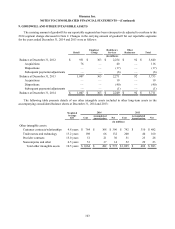
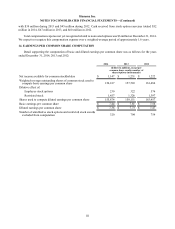
Amortization expense for other intangible assets was approximately $121 million in 2014, $117 million in 2013,
and $75 million in 2012. The following table presents our estimate of amortization expense for each of the five next
succeeding fiscal years:
(in millions)
For the years ending December 31,:
2015 $ 101
2016 94
2017 85
2018 78
2019 66
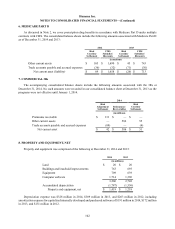
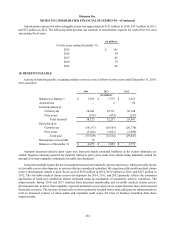
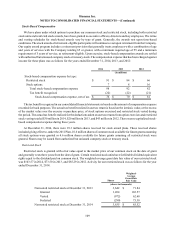
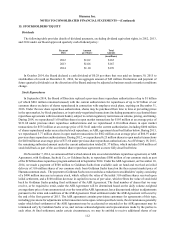
10. BENEFITS PAYABLE
Activity in benefits payable, excluding military services, was as follows for the years ended December 31, 2014,
2013 and 2012:
2014 2013 2012
(in millions)
Balances at January 1 $ 3,893 $ 3,775 $ 3,415
Acquisitions — 5 66
Incurred related to:
Current year 38,641 32,711 30,198
Prior years (518) (474)(257)
Total incurred 38,123 32,237 29,941
Paid related to:
Current year (34,357) (29,103)(26,738)
Prior years (3,262) (3,021)(2,909)
Total paid (37,619) (32,124)(29,647)
Reinsurance recoverable 78 — —
Balances at December 31 $ 4,475 $ 3,893 $ 3,775
Amounts incurred related to prior years vary from previously estimated liabilities as the claims ultimately are
settled. Negative amounts reported for incurred related to prior years result from claims being ultimately settled for
amounts less than originally estimated (favorable development).
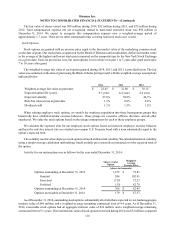
Actuarial standards require the use of assumptions based on moderately adverse experience, which generally results
in favorable reserve development, or reserves that are considered redundant. We experienced favorable medical claims
reserve development related to prior fiscal years of $518 million in 2014, $474 million in 2013, and $257 million in
2012. The favorable medical claims reserve development for 2014, 2013, and 2012 primarily reflects the consistent
application of trend and completion factors estimated using an assumption of moderately adverse conditions. The
improvements during 2014 and 2013 resulted from increased membership and favorable medical claims reserve
development due to better than originally expected utilization across most of our major business lines and increased
financial recoveries. The increase in financial recoveries primarily resulted from claim audit process enhancements as
well as increased volume of claim audits and expanded audit scope. All lines of business benefited from these
improvements.