Humana 2014 Annual Report Download - page 77
Download and view the complete annual report
Please find page 77 of the 2014 Humana annual report below. You can navigate through the pages in the report by either clicking on the pages listed below, or by using the keyword search tool below to find specific information within the annual report.-
 1
1 -
2
-
3
-
4
-
5
-
6
-
7
-
8
-
9
-
10
-
11
-
12
-
13
-
14
-
15
-
16
-
17
-
18
-
19
-
20
-
21
-
22
-
23
-
24
-
25
-
26
-
27
-
28
-
29
-
30
-
31
-
32
-
33
-
34
-
35
-
36
-
37
-
38
-
39
-
40
-
41
-
42
-
43
-
44
-
45
-
46
-
47
-
48
-
49
-
50
-
51
-
52
-
53
-
54
-
55
-
56
-
57
-
58
-
59
-
60
-
61
-
62
-
63
-
64
-
65
-
66
-
 67
67 -
 68
68 -
 69
69 -
 70
70 -
 71
71 -
 72
72 -
 73
73 -
 74
74 -
 75
75 -
 76
76 -
 77
77 -
 78
78 -
 79
79 -
 80
80 -
 81
81 -
 82
82 -
 83
83 -
 84
84 -
 85
85 -
 86
86 -
 87
87 -
88
-
89
-
90
-
91
-
92
-
93
-
94
-
95
-
96
-
97
-
98
-
99
-
100
-
101
-
102
-
103
-
104
-
105
-
106
-
107
-
108
-
109
-
110
-
111
-
112
-
113
-
114
-
115
-
116
-
117
-
118
-
119
-
120
-
121
-
122
-
123
-
124
-
125
-
126
-
127
-
128
-
129
-
130
-
131
-
132
-
133
-
134
-
135
-
136
-
137
-
138
-
139
-
140
-
141
-
142
-
143
-
144
-
145
-
146
-
147
-
148
-
149
-
150
-
151
-
152
-
153
-
154
-
155
-
156
-
157
-
158
 |
 |

69
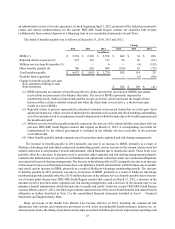
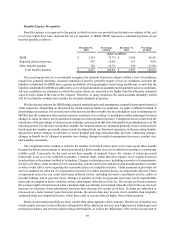
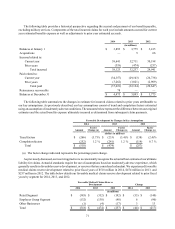
Benefits Expense Recognition
Benefits expense is recognized in the period in which services are provided and includes an estimate of the cost
of services which have been incurred but not yet reported, or IBNR. IBNR represents a substantial portion of our
benefits payable as follows:
December 31,
2014
Percentage
of Total
December 31,
2013
Percentage
of Total
(dollars in millions)
IBNR $ 3,254 72.7% $ 2,586 66.4%
Reported claims in process 475 10.6% 381 9.8%
Other benefits payable 746 16.7% 926 23.8%
Total benefits payable $ 4,475 100.0% $ 3,893 100.0%
Our reserving practice is to consistently recognize the actuarial best point estimate within a level of confidence
required by actuarial standards. Actuarial standards of practice generally require a level of confidence such that the
liabilities established for IBNR have a greater probability of being adequate versus being insufficient, or such that the
liabilities established for IBNR are sufficient to cover obligations under an assumption of moderately adverse conditions.
Adverse conditions are situations in which the actual claims are expected to be higher than the otherwise estimated
value of such claims at the time of the estimate. Therefore, in many situations, the claim amounts ultimately settled
will be less than the estimate that satisfies the actuarial standards of practice.
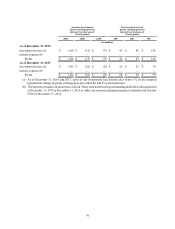
We develop our estimate for IBNR using actuarial methodologies and assumptions, primarily based upon historical
claim experience. Depending on the period for which incurred claims are estimated, we apply a different method in
determining our estimate. For periods prior to the most recent three months, the key assumption used in estimating our
IBNR is that the completion factor pattern remains consistent over a rolling 12-month period after adjusting for known
changes in claim inventory levels and known changes in claim payment processes. Completion factors result from the
calculation of the percentage of claims incurred during a given period that have historically been adjudicated as of the
reporting period. For the most recent three months, the incurred claims are estimated primarily from a trend analysis
based upon per member per month claims trends developed from our historical experience in the preceding months,
adjusted for known changes in estimates of recent hospital and drug utilization data, provider contracting changes,
changes in benefit levels, changes in member cost sharing, changes in medical management processes, product mix,
and weekday seasonality.
The completion factor method is used for the months of incurred claims prior to the most recent three months
because the historical percentage of claims processed for those months is at a level sufficient to produce a consistently
reliable result. Conversely, for the most recent three months of incurred claims, the volume of claims processed
historically is not at a level sufficient to produce a reliable result, which therefore requires us to examine historical
trend patterns as the primary method of evaluation. Changes in claim processes, including recoveries of overpayments,
receipt cycle times, claim inventory levels, outsourcing, system conversions, and processing disruptions due to weather
or other events affect views regarding the reasonable choice of completion factors. Claim payments to providers for
services rendered are often net of overpayment recoveries for claims paid previously, as contractually allowed. Claim
overpayment recoveries can result from many different factors, including retroactive enrollment activity, audits of
provider billings, and/or payment errors. Changes in patterns of claim overpayment recoveries can be unpredictable
and result in completion factor volatility, as they often impact older dates of service. The receipt cycle time measures
the average length of time between when a medical claim was initially incurred and when the claim form was received.
Increases in electronic claim submissions from providers decrease the receipt cycle time. If claims are submitted or
processed on a faster (slower) pace than prior periods, the actual claim may be more (less) complete than originally
estimated using our completion factors, which may result in reserves that are higher (lower) than required.
Medical cost trends potentially are more volatile than other segments of the economy. The drivers of medical cost
trends include increases in the utilization of hospital facilities, physician services, new higher priced technologies and
medical procedures, and new prescription drugs and therapies, as well as the inflationary effect on the cost per unit of