Humana 2014 Annual Report Download - page 67
Download and view the complete annual report
Please find page 67 of the 2014 Humana annual report below. You can navigate through the pages in the report by either clicking on the pages listed below, or by using the keyword search tool below to find specific information within the annual report.-
 1
1 -
2
-
3
-
4
-
5
-
6
-
7
-
8
-
9
-
10
-
11
-
12
-
13
-
14
-
15
-
16
-
17
-
18
-
19
-
20
-
21
-
22
-
23
-
24
-
25
-
26
-
27
-
28
-
29
-
30
-
31
-
32
-
33
-
34
-
35
-
36
-
37
-
38
-
39
-
40
-
41
-
42
-
43
-
44
-
45
-
46
-
47
-
48
-
49
-
50
-
51
-
52
-
53
-
54
-
55
-
56
-
 57
57 -
 58
58 -
 59
59 -
 60
60 -
 61
61 -
 62
62 -
 63
63 -
 64
64 -
 65
65 -
 66
66 -
 67
67 -
 68
68 -
 69
69 -
 70
70 -
 71
71 -
 72
72 -
 73
73 -
 74
74 -
 75
75 -
 76
76 -
 77
77 -
78
-
79
-
80
-
81
-
82
-
83
-
84
-
85
-
86
-
87
-
88
-
89
-
90
-
91
-
92
-
93
-
94
-
95
-
96
-
97
-
98
-
99
-
100
-
101
-
102
-
103
-
104
-
105
-
106
-
107
-
108
-
109
-
110
-
111
-
112
-
113
-
114
-
115
-
116
-
117
-
118
-
119
-
120
-
121
-
122
-
123
-
124
-
125
-
126
-
127
-
128
-
129
-
130
-
131
-
132
-
133
-
134
-
135
-
136
-
137
-
138
-
139
-
140
-
141
-
142
-
143
-
144
-
145
-
146
-
147
-
148
-
149
-
150
-
151
-
152
-
153
-
154
-
155
-
156
-
157
-
158
 |
 |

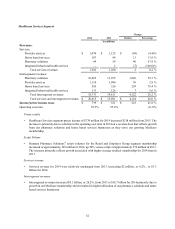
59
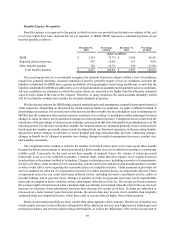
Change
2013 2012 Dollars Percentage
(in millions)
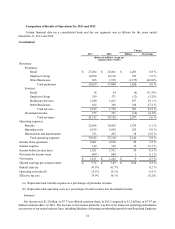
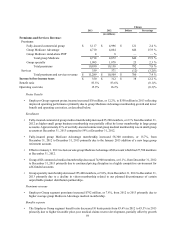
Premiums and Services Revenue:
Premiums:
Fully-insured commercial group $ 5,117 $ 4,996 $ 121 2.4 %
Group Medicare Advantage 4,710 4,064 646 15.9 %
Group Medicare stand-alone PDP 8 8 — — %
Total group Medicare 4,718 4,072 646 15.9 %
Group specialty 1,095 1,070 25 2.3 %
Total premiums 10,930 10,138 792 7.8 %
Services 359 371 (12) (3.2)%
Total premiums and services revenue $ 11,289 $ 10,509 $ 780 7.4 %
Income before income taxes $ 350 $ 312 $ 38 12.2 %
Benefit ratio 83.5% 83.6% (0.1)%
Operating cost ratio 15.9% 16.2% (0.3)%
Pretax Results
• Employer Group segment pretax income increased $38 million, or 12.2%, to $350 million in 2013 reflecting
improved operating performance primarily due to group Medicare Advantage membership growth and lower
benefit and operating cost ratios, as described below.
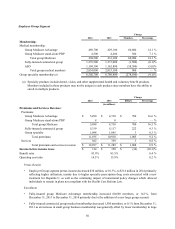
Enrollment
• Fully-insured commercial group medical membership increased 25,200 members, or 2.1% from December 31,
2012 as higher small group business membership was partially offset by lower membership in large group
accounts. Approximately 61% of our fully-insured commercial group medical membership was in small group
accounts at December 31, 2013 compared to 59% at December 31, 2012.
• Fully-insured group Medicare Advantage membership increased 58,300 members, or 15.7%, from
December 31, 2012 to December 31, 2013 primarily due to the January 2013 addition of a new large group
retirement account.
• Effective January 1, 2013 we lost our sole group Medicare Advantage ASO account which had 27,700 members
at December 31, 2012.
• Group ASO commercial medical membership decreased 74,900 members, or 6.1%, from December 31, 2012
to December 31, 2013 primarily due to continued pricing discipline in a highly competitive environment for
self-funded accounts.
• Group specialty membership decreased 355,400 members, or 5.0%, from December 31, 2012 to December 31,
2013 primarily due to a decline in vision membership related to our planned discontinuance of certain
unprofitable product distribution partnerships.
Premiums revenue
• Employer Group segment premiums increased $792 million, or 7.8%, from 2012 to 2013 primarily due to
higher average group Medicare Advantage medical membership.
Benefits expense
• The Employer Group segment benefit ratio decreased 10 basis points from 83.6% in 2012 to 83.5% in 2013
primarily due to higher favorable prior-year medical claims reserve development, partially offset by growth