Humana 2014 Annual Report Download - page 69
Download and view the complete annual report
Please find page 69 of the 2014 Humana annual report below. You can navigate through the pages in the report by either clicking on the pages listed below, or by using the keyword search tool below to find specific information within the annual report.-
 1
1 -
2
-
3
-
4
-
5
-
6
-
7
-
8
-
9
-
10
-
11
-
12
-
13
-
14
-
15
-
16
-
17
-
18
-
19
-
20
-
21
-
22
-
23
-
24
-
25
-
26
-
27
-
28
-
29
-
30
-
31
-
32
-
33
-
34
-
35
-
36
-
37
-
38
-
39
-
40
-
41
-
42
-
43
-
44
-
45
-
46
-
47
-
48
-
49
-
50
-
51
-
52
-
53
-
54
-
55
-
56
-
57
-
58
-
 59
59 -
 60
60 -
 61
61 -
 62
62 -
 63
63 -
 64
64 -
 65
65 -
 66
66 -
 67
67 -
 68
68 -
 69
69 -
 70
70 -
 71
71 -
 72
72 -
 73
73 -
 74
74 -
 75
75 -
 76
76 -
 77
77 -
 78
78 -
 79
79 -
80
-
81
-
82
-
83
-
84
-
85
-
86
-
87
-
88
-
89
-
90
-
91
-
92
-
93
-
94
-
95
-
96
-
97
-
98
-
99
-
100
-
101
-
102
-
103
-
104
-
105
-
106
-
107
-
108
-
109
-
110
-
111
-
112
-
113
-
114
-
115
-
116
-
117
-
118
-
119
-
120
-
121
-
122
-
123
-
124
-
125
-
126
-
127
-
128
-
129
-
130
-
131
-
132
-
133
-
134
-
135
-
136
-
137
-
138
-
139
-
140
-
141
-
142
-
143
-
144
-
145
-
146
-
147
-
148
-
149
-
150
-
151
-
152
-
153
-
154
-
155
-
156
-
157
-
158
 |
 |
61
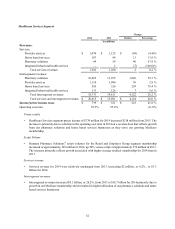
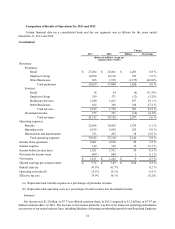
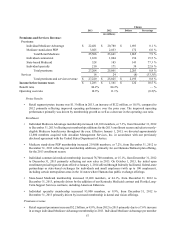
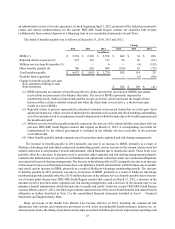
The increase primarily reflects growth associated with higher average medical membership for 2013 than in
2012.
Services revenue
• Services revenue increased $257 million or 25.1% from 2012 to $1.3 billion for 2013 primarily due to the
acquisitions of Metropolitan and SeniorBridge as well as growth in our provider services operations.
Intersegment revenues
• Intersegment revenues increased $2.6 billion, or 21.5%, from 2012 to $14.6 billion for 2013 primarily due to
growth in our pharmacy solutions business as it serves our growing membership, particularly Medicare stand-
alone PDP, and the acquisition of Metropolitan in the fourth quarter of 2012.
Operating costs
• The Healthcare Services segment operating cost ratio of 95.8% for 2013 decreased 30 basis points from 96.1%
for 2012 primarily due to scale efficiencies associated with growth in our pharmacy solutions business.
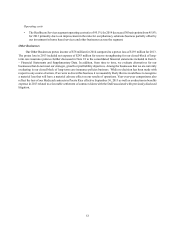
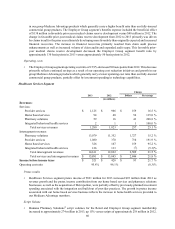
Other Businesses
Our Other Businesses pretax loss of $193 million for 2013 compared to a pretax loss of $18 million for 2012.
The pretax losses in 2013 and 2012 included net expense of $243 million and $29 million, respectively, for reserve
strengthening for our closed-block of long-term care insurance policies further discussed in Note 18 to the consolidated
financial statements included in Item 8. – Financial Statements and Supplementary Data. In addition, 2013 reflects the
loss of our Medicaid contracts in Puerto Rico effective September 30, 2013 offset by the beneficial effect of a favorable
settlement of contract claims with the DoD primarily associated with litigation settled in 2012.
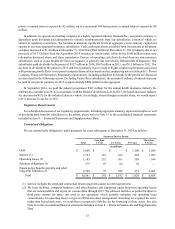
Liquidity
Our primary sources of cash include receipts of premiums, services revenue, and investment and other income, as
well as proceeds from the sale or maturity of our investment securities and borrowings. Our primary uses of cash include
disbursements for claims payments, operating costs, interest on borrowings, taxes, purchases of investment securities,
acquisitions, capital expenditures, repayments on borrowings, dividends, and share repurchases. Because premiums
generally are collected in advance of claim payments by a period of up to several months, our business normally should
produce positive cash flows during periods of increasing premiums and enrollment. Conversely, cash flows would be
negatively impacted during periods of decreasing premiums and enrollment. From period to period, our cash flows
may also be affected by the timing of working capital items including taxes and assessments. The use of operating cash
flows may be limited by regulatory requirements which require, among other items, that our regulated subsidiaries
maintain minimum levels of capital and seek approval before paying dividends from the subsidiaries to the parent. Our
use of operating cash flows derived from our non-insurance subsidiaries, such as in our Healthcare Services segment,
is generally not restricted by Departments of Insurance.
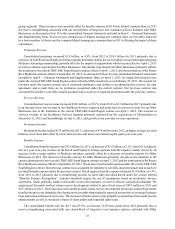
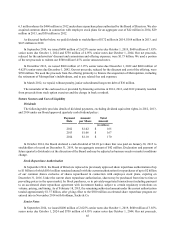
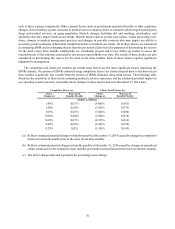
For 2014, the effect of the commercial risk adjustment, risk corridor, and reinsurance provisions of the Health Care
Reform Law, commonly referred to as the 3Rs, impacted the timing of our operating cash flows, as we built a receivable
in 2014 that is expected to be collected in 2015. The net receivable balance associated with the 3Rs was $679 million
at December 31, 2014. In addition, our 2014 financing cash flows have been negatively impacted by the timing of
payments to and receipts from CMS associated with Medicare Part D reinsurance subsidies for which we do not assume
risk. We are experiencing higher specialty prescription drug costs associated with a new treatment for Hepatitis C than
were contemplated in our bids which resulted in higher reinsurance subsidy receivables balances in 2014 that will be
settled in 2015 under the terms of our contracts with CMS. Any amounts receivable or payable associated with these
risk limiting programs and CMS subsidies may have an impact on regulated subsidiary liquidity, with any temporary
shortfalls funded by the parent company.
For additional information on our liquidity risk, please refer to Item 1A. – Risk Factors in this 2014 Form 10-K.