Humana 2014 Annual Report Download - page 53
Download and view the complete annual report
Please find page 53 of the 2014 Humana annual report below. You can navigate through the pages in the report by either clicking on the pages listed below, or by using the keyword search tool below to find specific information within the annual report.-
 1
1 -
2
-
3
-
4
-
5
-
6
-
7
-
8
-
9
-
10
-
11
-
12
-
13
-
14
-
15
-
16
-
17
-
18
-
19
-
20
-
21
-
22
-
23
-
24
-
25
-
26
-
27
-
28
-
29
-
30
-
31
-
32
-
33
-
34
-
35
-
36
-
37
-
38
-
39
-
40
-
41
-
42
-
 43
43 -
 44
44 -
 45
45 -
 46
46 -
 47
47 -
 48
48 -
 49
49 -
 50
50 -
 51
51 -
 52
52 -
 53
53 -
 54
54 -
 55
55 -
 56
56 -
 57
57 -
 58
58 -
 59
59 -
 60
60 -
 61
61 -
 62
62 -
 63
63 -
64
-
65
-
66
-
67
-
68
-
69
-
70
-
71
-
72
-
73
-
74
-
75
-
76
-
77
-
78
-
79
-
80
-
81
-
82
-
83
-
84
-
85
-
86
-
87
-
88
-
89
-
90
-
91
-
92
-
93
-
94
-
95
-
96
-
97
-
98
-
99
-
100
-
101
-
102
-
103
-
104
-
105
-
106
-
107
-
108
-
109
-
110
-
111
-
112
-
113
-
114
-
115
-
116
-
117
-
118
-
119
-
120
-
121
-
122
-
123
-
124
-
125
-
126
-
127
-
128
-
129
-
130
-
131
-
132
-
133
-
134
-
135
-
136
-
137
-
138
-
139
-
140
-
141
-
142
-
143
-
144
-
145
-
146
-
147
-
148
-
149
-
150
-
151
-
152
-
153
-
154
-
155
-
156
-
157
-
158
 |
 |

45
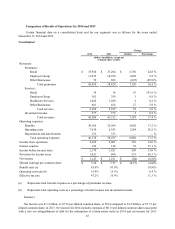
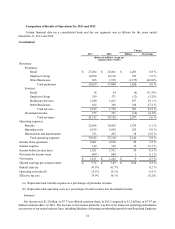
Comparison of Results of Operations for 2014 and 2013
Certain financial data on a consolidated basis and for our segments was as follows for the years ended
December 31, 2014 and 2013:
Consolidated
Change
2014 2013 Dollars Percentage
(dollars in millions, except per
common share results)
Revenues:
Premiums:
Retail $ 33,954 $ 27,204 $ 6,750 24.8 %
Employer Group 11,935 10,930 1,005 9.2 %
Other Businesses 70 695 (625) (89.9)%
Total premiums 45,959 38,829 7,130 18.4 %
Services:
Retail 39 16 23 143.8 %
Employer Group 362 359 3 0.8 %
Healthcare Services 1,282 1,280 2 0.2 %
Other Businesses 481 454 27 5.9 %
Total services 2,164 2,109 55 2.6 %
Investment income 377 375 2 0.5 %
Total revenues 48,500 41,313 7,187 17.4 %
Operating expenses:
Benefits 38,166 32,564 5,602 17.2 %
Operating costs 7,639 6,355 1,284 20.2 %
Depreciation and amortization 333 333 — — %
Total operating expenses 46,138 39,252 6,886 17.5 %
Income from operations 2,362 2,061 301 14.6 %
Interest expense 192 140 52 37.1 %
Income before income taxes 2,170 1,921 249 13.0 %
Provision for income taxes 1,023 690 333 48.3 %
Net income $ 1,147 $ 1,231 $ (84) (6.8)%
Diluted earnings per common share $ 7.36 $ 7.73 $ (0.37) (4.8)%
Benefit ratio (a) 83.0% 83.9% (0.9)%
Operating cost ratio (b) 15.9% 15.5% 0.4 %
Effective tax rate 47.2% 35.9% 11.3 %
(a) Represents total benefits expense as a percentage of premiums revenue.
(b) Represents total operating costs as a percentage of total revenues less investment income.
Summary
Net income was $1.1 billion, or $7.36 per diluted common share, in 2014 compared to $1.2 billion, or $7.73 per
diluted common share, in 2013. Net income for 2014 includes expenses of $0.15 per diluted common share associated
with a loss on extinguishment of debt for the redemption of certain senior notes in 2014 and net income for 2013