Humana 2014 Annual Report Download - page 63
Download and view the complete annual report
Please find page 63 of the 2014 Humana annual report below. You can navigate through the pages in the report by either clicking on the pages listed below, or by using the keyword search tool below to find specific information within the annual report.-
 1
1 -
2
-
3
-
4
-
5
-
6
-
7
-
8
-
9
-
10
-
11
-
12
-
13
-
14
-
15
-
16
-
17
-
18
-
19
-
20
-
21
-
22
-
23
-
24
-
25
-
26
-
27
-
28
-
29
-
30
-
31
-
32
-
33
-
34
-
35
-
36
-
37
-
38
-
39
-
40
-
41
-
42
-
43
-
44
-
45
-
46
-
47
-
48
-
49
-
50
-
51
-
52
-
 53
53 -
 54
54 -
 55
55 -
 56
56 -
 57
57 -
 58
58 -
 59
59 -
 60
60 -
 61
61 -
 62
62 -
 63
63 -
 64
64 -
 65
65 -
 66
66 -
 67
67 -
 68
68 -
 69
69 -
 70
70 -
 71
71 -
 72
72 -
 73
73 -
74
-
75
-
76
-
77
-
78
-
79
-
80
-
81
-
82
-
83
-
84
-
85
-
86
-
87
-
88
-
89
-
90
-
91
-
92
-
93
-
94
-
95
-
96
-
97
-
98
-
99
-
100
-
101
-
102
-
103
-
104
-
105
-
106
-
107
-
108
-
109
-
110
-
111
-
112
-
113
-
114
-
115
-
116
-
117
-
118
-
119
-
120
-
121
-
122
-
123
-
124
-
125
-
126
-
127
-
128
-
129
-
130
-
131
-
132
-
133
-
134
-
135
-
136
-
137
-
138
-
139
-
140
-
141
-
142
-
143
-
144
-
145
-
146
-
147
-
148
-
149
-
150
-
151
-
152
-
153
-
154
-
155
-
156
-
157
-
158
 |
 |
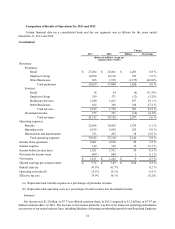
55
group segments. These increases were partially offset by benefits expense of $0.99 per diluted common share in 2013
for reserve strengthening associated with our closed-block of long-term care insurance policies included with Other
Businesses as discussed in Note 18 to the consolidated financial statements included in Item 8. – Financial Statements
and Supplementary Data. Year-over-year comparisons of diluted earnings per common share are favorably impacted
by a lower number of shares used to compute diluted earnings per common share in 2013 reflecting the impact of share
repurchases.
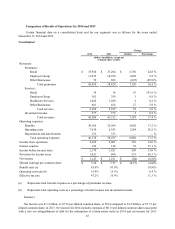
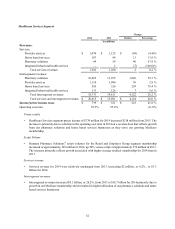
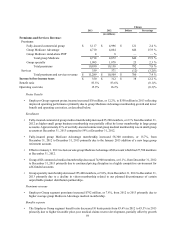
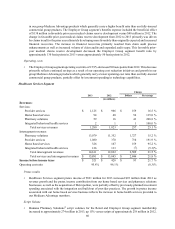
Premiums Revenue
Consolidated premiums increased $1.8 billion, or 4.9%, from 2012 to $38.8 billion for 2013 primarily due to
increases in both Retail and Employer Group segment premiums mainly driven by higher average individual and group
Medicare Advantage membership, partially offset by the impact of sequestration which became effective April 1, 2013
as well as a decline in premiums for Other Businesses. The decline in premiums for Other Businesses primarily reflects
the transition to the current TRICARE South Region contract effective April 1, 2012, and the termination of the Puerto
Rico Medicaid contracts effective September 30, 2013. As discussed in Note 2 to the consolidated financial statements
included in Item 8. – Financial Statements and Supplementary Data, on April 1, 2012, we began delivering services
under the current TRICARE South Region contract that the DHA awarded to us on February 25, 2011. We account for
revenues under the current contract net of estimated healthcare costs similar to an administrative services fee only
agreement, and as such there are no premiums recognized under the current contract. Our previous contract was
accounted for similar to our fully-insured products and as such we recognized premiums under the previous contract.
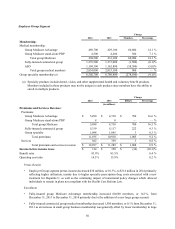
Services Revenue
Consolidated services revenue increased $383 million, or 22.2%, from 2012 to $2.1 billion for 2013 primarily due
to an increase in services revenue in our Healthcare Services segment and an increase in services revenue for our Other
Businesses due to the transition to the current TRICARE South Region contract on April 1, 2012. The increase in
services revenue in our Healthcare Services segment primarily resulted from the acquisitions of Metropolitan on
December 21, 2012 and SeniorBridge on July 6, 2012, and growth in our provider services operations.
Investment Income
Investment income totaled $375 million for 2013, a decrease of $16 million from 2012, as higher average invested
balances were more than offset by lower interest rates and lower net realized capital gains year-over-year.
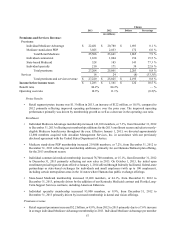
Benefits Expense
Consolidated benefits expense was $32.6 billion for 2013, an increase of $1.6 billion, or 5.1%, from 2012 primarily
due to a year-over-year increase in the Retail and Employer Group segments benefits expense, mainly driven by an
increase in the average number of Medicare members, partially offset by a decrease in benefits expense for Other
Businesses in 2013. The decrease in benefits expense for Other Businesses primarily was due to the transition to the
current administrative services only TRICARE South Region contract on April 1, 2012 and the termination of the Puerto
Rico Medicaid contracts effective September 30, 2013. We do not record benefits expense under the current TRICARE
South Region contract. Our previous contract was accounted for similarly to our fully-insured products and as such we
recorded benefits expense under the previous contract. Retail segment benefits expense increased $1.9 billion, or 8.9%,
from 2012 to 2013 primarily due to membership growth. As more fully described herein under the section entitled
“Benefits Expense Recognition”, actuarial standards require the use of assumptions based on moderately adverse
experience, which generally results in favorable reserve development, or reserves that are considered redundant. We
experienced favorable medical claims reserve development related to prior fiscal years of $474 million in 2013 and
$257 million in 2012. These increases in favorable medical claims reserve development primarily resulted from claims
trend for the prior year ultimately developing more favorably than originally expected across most of our major business
lines and increased financial recoveries. The increase in financial recoveries primarily resulted from claim audit process
enhancements as well as increased volume of claim audits and expanded audit scope.
The consolidated benefit ratio for 2013 was 83.9%, an increase of 20 basis points from 2012 primarily due to
reserve strengthening associated with our closed-block of long-term care insurance policies included with Other