Humana 2014 Annual Report Download - page 128
Download and view the complete annual report
Please find page 128 of the 2014 Humana annual report below. You can navigate through the pages in the report by either clicking on the pages listed below, or by using the keyword search tool below to find specific information within the annual report.-
 1
1 -
2
-
3
-
4
-
5
-
6
-
7
-
8
-
9
-
10
-
11
-
12
-
13
-
14
-
15
-
16
-
17
-
18
-
19
-
20
-
21
-
22
-
23
-
24
-
25
-
26
-
27
-
28
-
29
-
30
-
31
-
32
-
33
-
34
-
35
-
36
-
37
-
38
-
39
-
40
-
41
-
42
-
43
-
44
-
45
-
46
-
47
-
48
-
49
-
50
-
51
-
52
-
53
-
54
-
55
-
56
-
57
-
58
-
59
-
60
-
61
-
62
-
63
-
64
-
65
-
66
-
67
-
68
-
69
-
70
-
71
-
72
-
73
-
74
-
75
-
76
-
77
-
78
-
79
-
80
-
81
-
82
-
83
-
84
-
85
-
86
-
87
-
88
-
89
-
90
-
91
-
92
-
93
-
94
-
95
-
96
-
97
-
98
-
99
-
100
-
101
-
102
-
103
-
104
-
105
-
106
-
107
-
108
-
109
-
110
-
111
-
112
-
113
-
114
-
115
-
116
-
117
-
 118
118 -
 119
119 -
 120
120 -
 121
121 -
 122
122 -
 123
123 -
 124
124 -
 125
125 -
 126
126 -
 127
127 -
 128
128 -
 129
129 -
 130
130 -
 131
131 -
 132
132 -
 133
133 -
 134
134 -
 135
135 -
 136
136 -
 137
137 -
 138
138 -
139
-
140
-
141
-
142
-
143
-
144
-
145
-
146
-
147
-
148
-
149
-
150
-
151
-
152
-
153
-
154
-
155
-
156
-
157
-
158
 |
 |

Humana Inc.
NOTES TO CONSOLIDATED FINANCIAL STATEMENTS—(Continued)
120
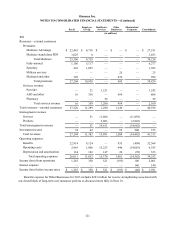
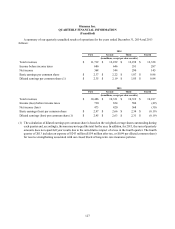
Our segment results were as follows for the years ended December 31, 2014, 2013, and 2012:
Retail
Employer
Group
Healthcare
Services
Other
Businesses
Eliminations/
Corporate Consolidated
(in millions)
2014
Revenues—external customers
Premiums:
Medicare Advantage $ 25,941 $ 5,490 $ — $ — $ — $ 31,431
Medicare stand-alone PDP 3,396 8 — — — 3,404
Total Medicare 29,337 5,498 — — — 34,835
Fully-insured 3,265 5,339 — — — 8,604
Specialty 256 1,098 — — — 1,354
Military services ———19 — 19
Medicaid and other 1,096——51 —1,147
Total premiums 33,954 11,935 — 70 — 45,959
Services revenue:
Provider — 23 1,183 — — 1,206
ASO and other 39 339 — 481 — 859
Pharmacy ——99— — 99
Total services revenue 39 362 1,282 481 — 2,164
Total revenues—external customers 33,993 12,297 1,282 551 — 48,123
Intersegment revenues
Services — 78 14,984 — (15,062)—
Products — — 3,749 — (3,749)—
Total intersegment revenues — 78 18,733 — (18,811)—
Investment income 76 44 — 60 197 377
Total revenues 34,069 12,419 20,015 611 (18,614) 48,500
Operating expenses:
Benefits 28,608 10,019 — 113 (574) 38,166
Operating costs 4,209 1,987 19,121 405 (18,083) 7,639
Depreciation and amortization 154 99 155 15 (90) 333
Total operating expenses 32,971 12,105 19,276 533 (18,747) 46,138
Income from operations 1,098 314 739 78 133 2,362
Interest expense ———— 192 192
Income (loss) before income taxes $ 1,098 $ 314 $ 739 $ 78 $ (59) $ 2,170
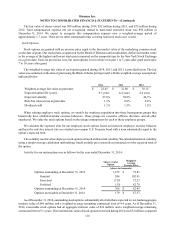
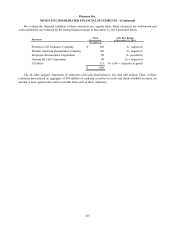
Premium and services revenues derived from our contracts with the federal government, as a percentage of our
total premium and services revenues, was approximately 73% for 2014, compared to 75% for 2013 and 2012.