Humana 2014 Annual Report Download - page 44
Download and view the complete annual report
Please find page 44 of the 2014 Humana annual report below. You can navigate through the pages in the report by either clicking on the pages listed below, or by using the keyword search tool below to find specific information within the annual report.-
 1
1 -
2
-
3
-
4
-
5
-
6
-
7
-
8
-
9
-
10
-
11
-
12
-
13
-
14
-
15
-
16
-
17
-
18
-
19
-
20
-
21
-
22
-
23
-
24
-
25
-
26
-
27
-
28
-
29
-
30
-
31
-
32
-
33
-
 34
34 -
 35
35 -
 36
36 -
 37
37 -
 38
38 -
 39
39 -
 40
40 -
 41
41 -
 42
42 -
 43
43 -
 44
44 -
 45
45 -
 46
46 -
 47
47 -
 48
48 -
 49
49 -
 50
50 -
 51
51 -
 52
52 -
 53
53 -
 54
54 -
55
-
56
-
57
-
58
-
59
-
60
-
61
-
62
-
63
-
64
-
65
-
66
-
67
-
68
-
69
-
70
-
71
-
72
-
73
-
74
-
75
-
76
-
77
-
78
-
79
-
80
-
81
-
82
-
83
-
84
-
85
-
86
-
87
-
88
-
89
-
90
-
91
-
92
-
93
-
94
-
95
-
96
-
97
-
98
-
99
-
100
-
101
-
102
-
103
-
104
-
105
-
106
-
107
-
108
-
109
-
110
-
111
-
112
-
113
-
114
-
115
-
116
-
117
-
118
-
119
-
120
-
121
-
122
-
123
-
124
-
125
-
126
-
127
-
128
-
129
-
130
-
131
-
132
-
133
-
134
-
135
-
136
-
137
-
138
-
139
-
140
-
141
-
142
-
143
-
144
-
145
-
146
-
147
-
148
-
149
-
150
-
151
-
152
-
153
-
154
-
155
-
156
-
157
-
158
 |
 |
36
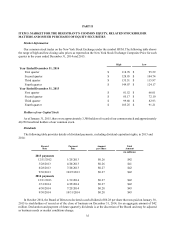
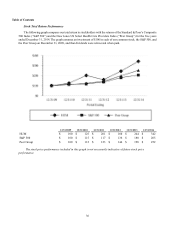
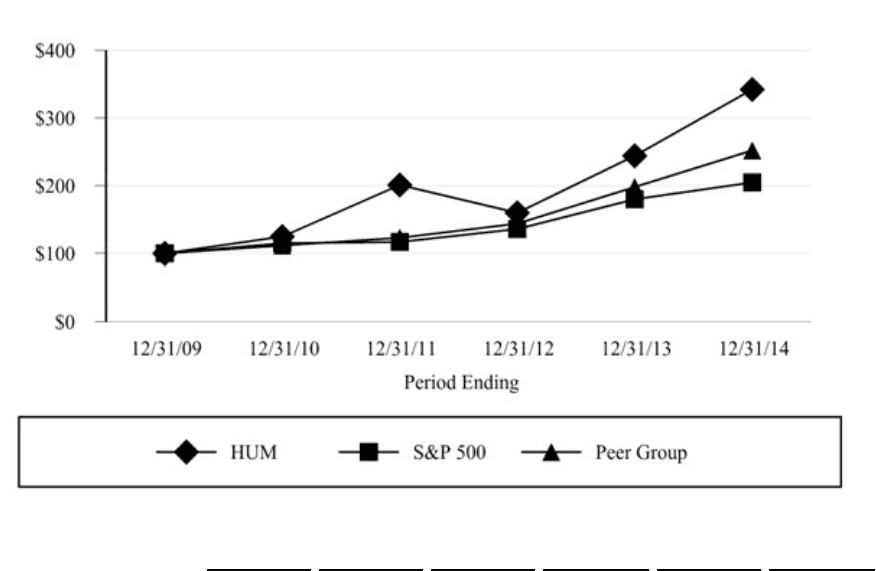
Stock Total Return Performance
The following graph compares our total return to stockholders with the returns of the Standard & Poor’s Composite
500 Index (“S&P 500”) and the Dow Jones US Select Health Care Providers Index (“Peer Group”) for the five years
ended December 31, 2014. The graph assumes an investment of $100 in each of our common stock, the S&P 500, and
the Peer Group on December 31, 2009, and that dividends were reinvested when paid.
12/31/2009 12/31/2010 12/31/2011 12/31/2012 12/31/2013 12/31/2014
HUM $ 100 $ 125 $ 201 $ 160 $ 244 $ 342
S&P 500 $ 100 $ 115 $ 117 $ 136 $ 180 $ 205
Peer Group $ 100 $ 112 $ 123 $ 144 $ 198 $ 252
The stock price performance included in this graph is not necessarily indicative of future stock price
performance.
Table of Contents