Humana 2014 Annual Report Download - page 129
Download and view the complete annual report
Please find page 129 of the 2014 Humana annual report below. You can navigate through the pages in the report by either clicking on the pages listed below, or by using the keyword search tool below to find specific information within the annual report.-
 1
1 -
2
-
3
-
4
-
5
-
6
-
7
-
8
-
9
-
10
-
11
-
12
-
13
-
14
-
15
-
16
-
17
-
18
-
19
-
20
-
21
-
22
-
23
-
24
-
25
-
26
-
27
-
28
-
29
-
30
-
31
-
32
-
33
-
34
-
35
-
36
-
37
-
38
-
39
-
40
-
41
-
42
-
43
-
44
-
45
-
46
-
47
-
48
-
49
-
50
-
51
-
52
-
53
-
54
-
55
-
56
-
57
-
58
-
59
-
60
-
61
-
62
-
63
-
64
-
65
-
66
-
67
-
68
-
69
-
70
-
71
-
72
-
73
-
74
-
75
-
76
-
77
-
78
-
79
-
80
-
81
-
82
-
83
-
84
-
85
-
86
-
87
-
88
-
89
-
90
-
91
-
92
-
93
-
94
-
95
-
96
-
97
-
98
-
99
-
100
-
101
-
102
-
103
-
104
-
105
-
106
-
107
-
108
-
109
-
110
-
111
-
112
-
113
-
114
-
115
-
116
-
117
-
118
-
 119
119 -
 120
120 -
 121
121 -
 122
122 -
 123
123 -
 124
124 -
 125
125 -
 126
126 -
 127
127 -
 128
128 -
 129
129 -
 130
130 -
 131
131 -
 132
132 -
 133
133 -
 134
134 -
 135
135 -
 136
136 -
 137
137 -
 138
138 -
 139
139 -
140
-
141
-
142
-
143
-
144
-
145
-
146
-
147
-
148
-
149
-
150
-
151
-
152
-
153
-
154
-
155
-
156
-
157
-
158
 |
 |

Humana Inc.
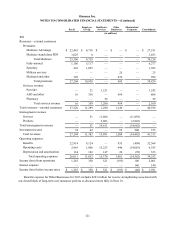
NOTES TO CONSOLIDATED FINANCIAL STATEMENTS—(Continued)
121
Retail
Employer
Group
Healthcare
Services
Other
Businesses
Eliminations/
Corporate Consolidated
(in millions)
2013
Revenues—external customers
Premiums:
Medicare Advantage $ 22,481 $ 4,710 $ — $ — $ — $ 27,191
Medicare stand-alone PDP 3,025 8 — — — 3,033
Total Medicare 25,506 4,718 — — — 30,224
Fully-insured 1,160 5,117 — — — 6,277
Specialty 210 1,095 — — — 1,305
Military services ———25 — 25
Medicaid and other 328 — — 670 — 998
Total premiums 27,204 10,930 — 695 — 38,829
Services revenue:
Provider — 21 1,221 — — 1,242
ASO and other 16 338 — 454 — 808
Pharmacy ——59— — 59
Total services revenue 16 359 1,280 454 — 2,109
Total revenues—external customers 27,220 11,289 1,280 1,149 — 40,938
Intersegment revenues
Services — 51 11,808 — (11,859)—
Products — — 2,803 — (2,803)—
Total intersegment revenues — 51 14,611 — (14,662)—
Investment income 74 42 — 59 200 375
Total revenues 27,294 11,382 15,891 1,208 (14,462) 41,313
Operating expenses:
Benefits 22,914 9,124 — 935 (409) 32,564
Operating costs 2,963 1,806 15,223 446 (14,083) 6,355
Depreciation and amortization 134 102 147 20 (70) 333
Total operating expenses 26,011 11,032 15,370 1,401 (14,562) 39,252
Income (loss) from operations 1,283 350 521 (193) 100 2,061
Interest expense ———— 140140
Income (loss) before income taxes $ 1,283 $ 350 $ 521 $ (193)$ (40) $ 1,921
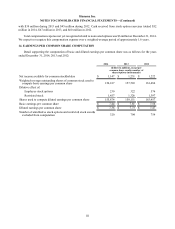
Benefits expense for Other Businesses for 2013 includes $243 million for reserve strengthening associated with
our closed block of long-term care insurance policies as discussed more fully in Note 18.