Philips 2004 Annual Report Download - page 117
Download and view the complete annual report
Please find page 117 of the 2004 Philips annual report below. You can navigate through the pages in the report by either clicking on the pages listed below, or by using the keyword search tool below to find specific information within the annual report.-
 1
1 -
2
-
3
-
4
-
5
-
6
-
7
-
8
-
9
-
10
-
11
-
12
-
13
-
14
-
15
-
16
-
17
-
18
-
19
-
20
-
21
-
22
-
23
-
24
-
25
-
26
-
27
-
28
-
29
-
30
-
31
-
32
-
33
-
34
-
35
-
36
-
37
-
38
-
39
-
40
-
41
-
42
-
43
-
44
-
45
-
46
-
47
-
48
-
49
-
50
-
51
-
52
-
53
-
54
-
55
-
56
-
57
-
58
-
59
-
60
-
61
-
62
-
63
-
64
-
65
-
66
-
67
-
68
-
69
-
70
-
71
-
72
-
73
-
74
-
75
-
76
-
77
-
78
-
79
-
80
-
81
-
82
-
83
-
84
-
85
-
86
-
87
-
88
-
89
-
90
-
91
-
92
-
93
-
94
-
95
-
96
-
97
-
98
-
99
-
100
-
101
-
102
-
103
-
104
-
105
-
106
-
 107
107 -
 108
108 -
 109
109 -
 110
110 -
 111
111 -
 112
112 -
 113
113 -
 114
114 -
 115
115 -
 116
116 -
 117
117 -
 118
118 -
 119
119 -
 120
120 -
 121
121 -
 122
122 -
 123
123 -
 124
124 -
 125
125 -
 126
126 -
 127
127 -
128
-
129
-
130
-
131
-
132
-
133
-
134
-
135
-
136
-
137
-
138
-
139
-
140
-
141
-
142
-
143
-
144
-
145
-
146
-
147
-
148
-
149
-
150
-
151
-
152
-
153
-
154
-
155
-
156
-
157
-
158
-
159
-
160
-
161
-
162
-
163
-
164
-
165
-
166
-
167
-
168
-
169
-
170
-
171
-
172
-
173
-
174
-
175
-
176
-
177
-
178
-
179
-
180
-
181
-
182
-
183
-
184
-
185
-
186
-
187
-
188
-
189
-
190
-
191
-
192
-
193
-
194
-
195
-
196
-
197
-
198
-
199
-
200
-
201
-
202
-
203
-
204
-
205
-
206
-
207
-
208
-
209
-
210
-
211
-
212
-
213
-
214
-
215
-
216
-
217
-
218
-
219
 |
 |

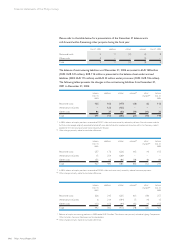
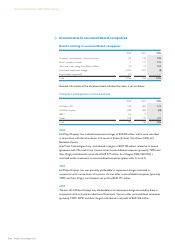
Please refer to the table below for a presentation of the December 31 balance and a
roll-forward within Remaining other projects during the fiscal year:
Dec. 31, 2003 additions utilized released Dec. 31, 2004
Personnel costs 5 11 (10) (4) 2
Other costs 4 – – (4) –
Total 9 11 (10) (8) 2
The balance of restructuring liabilities as of December 31, 2004 amounted to EUR 148 million
(2003: EUR 241 million), EUR 114 million is presented in the balance sheet under accrued
liabilities (2003: EUR 115 million) and EUR 34 million under provisions (2003: EUR 126 million).
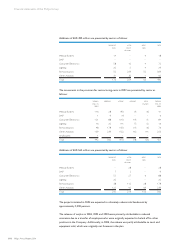
The following tables presents the changes in the restructuring liabilities from December 31,
2001 to December 31, 2004:
balance additions utilized released*other balance
Dec. 31, changes** Dec. 31,
2003 2004
Personnel costs 155 153 (177) (13) (5) 113
Write-down of assets – 125 (125) – – –
Other costs 86 37 (63) (14) (11)35
Total 241 315 (365) (27) (16) 148
*In 2004, releases of surplus provisions amounted to EUR 27 million and were caused by reduced lay-off costs. Natural turnover and the
fact that certain people, originally expected to be laid off, were able to find other employment elsewhere within the Company, made it
possible for the restructuring provision to be reduced and released.
** Other changes primarily related to translation differences.
balance additions utilized released*other balance
Dec. 31, changes** Dec. 31,
2002 2003
Personnel costs 257 173 (226) (45) (4) 155
Write-down of assets 15 254 (269) – – –
Other costs 155 63 (86) (38)(8)86
Total 427 490 (581) (83) (12) 241
*In 2003, releases of surplus provisions amounted to EUR 83 million and were mainly caused by reduced severance payments.
** Other changes primarily related to translation differences.
balance additions utilized released* other balance
Dec. 31, changes** Dec. 31,
2001 2002
Personnel costs 326 245 (235) (61) (18) 257
Write-down of assets 6 214 (194) (7) (4) 15
Other costs 110 103 (44) (10)(4) 155
Total 442 562 (473) (78) (26) 427
*Releases of surplus restructuring provisions in 2002 totaled EUR 78 million. The releases were primarily related to Lighting, Components,
Other Activities, Consumer Electronics and Semiconductors.
** Other changes primarily related to translation differences.
116 Philips Annual Report 2004
Financial statements of the Philips Group