Philips 2004 Annual Report Download - page 59
Download and view the complete annual report
Please find page 59 of the 2004 Philips annual report below. You can navigate through the pages in the report by either clicking on the pages listed below, or by using the keyword search tool below to find specific information within the annual report.-
 1
1 -
2
-
3
-
4
-
5
-
6
-
7
-
8
-
9
-
10
-
11
-
12
-
13
-
14
-
15
-
16
-
17
-
18
-
19
-
20
-
21
-
22
-
23
-
24
-
25
-
26
-
27
-
28
-
29
-
30
-
31
-
32
-
33
-
34
-
35
-
36
-
37
-
38
-
39
-
40
-
41
-
42
-
43
-
44
-
45
-
46
-
47
-
48
-
 49
49 -
 50
50 -
 51
51 -
 52
52 -
 53
53 -
 54
54 -
 55
55 -
 56
56 -
 57
57 -
 58
58 -
 59
59 -
 60
60 -
 61
61 -
 62
62 -
 63
63 -
 64
64 -
 65
65 -
 66
66 -
 67
67 -
 68
68 -
 69
69 -
70
-
71
-
72
-
73
-
74
-
75
-
76
-
77
-
78
-
79
-
80
-
81
-
82
-
83
-
84
-
85
-
86
-
87
-
88
-
89
-
90
-
91
-
92
-
93
-
94
-
95
-
96
-
97
-
98
-
99
-
100
-
101
-
102
-
103
-
104
-
105
-
106
-
107
-
108
-
109
-
110
-
111
-
112
-
113
-
114
-
115
-
116
-
117
-
118
-
119
-
120
-
121
-
122
-
123
-
124
-
125
-
126
-
127
-
128
-
129
-
130
-
131
-
132
-
133
-
134
-
135
-
136
-
137
-
138
-
139
-
140
-
141
-
142
-
143
-
144
-
145
-
146
-
147
-
148
-
149
-
150
-
151
-
152
-
153
-
154
-
155
-
156
-
157
-
158
-
159
-
160
-
161
-
162
-
163
-
164
-
165
-
166
-
167
-
168
-
169
-
170
-
171
-
172
-
173
-
174
-
175
-
176
-
177
-
178
-
179
-
180
-
181
-
182
-
183
-
184
-
185
-
186
-
187
-
188
-
189
-
190
-
191
-
192
-
193
-
194
-
195
-
196
-
197
-
198
-
199
-
200
-
201
-
202
-
203
-
204
-
205
-
206
-
207
-
208
-
209
-
210
-
211
-
212
-
213
-
214
-
215
-
216
-
217
-
218
-
219
 |
 |

Unallocated
Corporate & Regional Overheads
The costs of the corporate center, including a part of the
Company’s global brand management and sustainability programs,
as well as country and regional overheads, are not attributable to
the product sectors but are reported separately under
Unallocated.
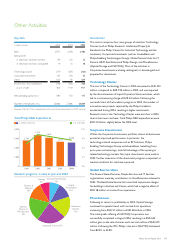
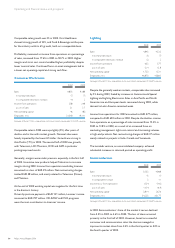
Key data
2002 2003 2004
Corporate and regional overheads (332) (307) (367)
Pensions/postretirement benefit costs 2 (254) (151)
Income (loss) from operations (330) (561) (518)
Number of employees (FTEs) 4,315 2,473* 2,609
* Reclassification to Other Activities in 2003: 1,623
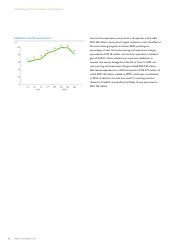
After showing a decrease during 2003, the corporate and regional
overhead costs increased by EUR 60 million in 2004, mainly due to
spending on the global brand campaign, which totaled EUR 80
million, of which EUR 22 million was spent by the product
divisions and EUR 58 million by Corporate & Regional
organizations.
The total pension costs for the Company in 2004 amounted to
EUR 284 million, a decrease of EUR 158 million compared to
2003, mainly caused by the renegotiated pension agreements in
the Netherlands. Of these pension costs of EUR 284 million, a
total of EUR 172 million was absorbed by the product divisions
and the remaining EUR 112 million at Corporate level. Net
postretirement benefit costs amounted to EUR 39 million.
The change agreed with Dutch trade unions from a final-pay to an
average-pay pension system in the Netherlands, which includes a
limitation of the indexation, has resulted in a reduction of the
Company’s projected benefit obligation. In addition, the transfer of
existing pension obligations into a pre-retirement fund led to a
further reduction of the projected benefit obligations together
with a reduction of pension plan assets.
The increase in the number of employees occurred mainly in Asia,
reflecting our continued focus on growth areas, especially China
and India.
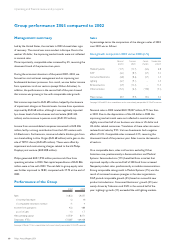
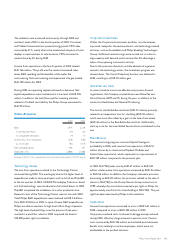
Performance by region
2003 2004
sales income (loss)
from
operations
sales income from
operations
Europe and Africa 12,768 916 13,335 1,225
North America 7,911 (411) 7,448 78
Latin America 1,236 (27) 1,513 52
Asia Pacific 7,122 10 8,023 252
29,037 488 30,319 1,607
Sales in Europe grew by 4% in 2004; divestments and weaker
currencies had a 1% downward effect. All divisions except DAP
recorded sales growth, led by Semiconductors, Other Activities
and Consumer Electronics. There was a slight decline in sales in a
number of countries (Ireland, Portugal and Sweden), but this was
more than offset by strong sales in Eastern Europe and Germany.
Sales in North America decreased by 6%, largely because of the
weaker US dollar. On a comparable basis, sales increased by 3%.
This was attributable to all sectors except DAP and
Semiconductors.
Sales in Latin America grew by 22% (32% on a comparable basis).
Weaker currencies had a 9% downward effect on growth. All
sectors posted double-digit growth, except Lighting, where sales
grew by 7% on a comparable basis. Consumer Electronics,
Semiconductors and Medical Systems posted comparable growth
of 52%, 34% and 27% respectively.
Sales in Asia Pacific increased by 13%, hampered by the negative
effect of weak US dollar-related currencies. On a comparable
basis, sales grew by 17%, headed by China. Excluding the effects of
changes in consolidation and currencies, double-digit growth was
visible across all sectors except Medical Systems and DAP, which
both grew by 8%.
Income from operations improved in 2004 and was positive in
every region. The main visible improvements were in Europe and
North America.
58 Philips Annual Report 2004
Operating and financial review and prospects