Philips 2004 Annual Report Download - page 58
Download and view the complete annual report
Please find page 58 of the 2004 Philips annual report below. You can navigate through the pages in the report by either clicking on the pages listed below, or by using the keyword search tool below to find specific information within the annual report.-
 1
1 -
2
-
3
-
4
-
5
-
6
-
7
-
8
-
9
-
10
-
11
-
12
-
13
-
14
-
15
-
16
-
17
-
18
-
19
-
20
-
21
-
22
-
23
-
24
-
25
-
26
-
27
-
28
-
29
-
30
-
31
-
32
-
33
-
34
-
35
-
36
-
37
-
38
-
39
-
40
-
41
-
42
-
43
-
44
-
45
-
46
-
47
-
 48
48 -
 49
49 -
 50
50 -
 51
51 -
 52
52 -
 53
53 -
 54
54 -
 55
55 -
 56
56 -
 57
57 -
 58
58 -
 59
59 -
 60
60 -
 61
61 -
 62
62 -
 63
63 -
 64
64 -
 65
65 -
 66
66 -
 67
67 -
 68
68 -
69
-
70
-
71
-
72
-
73
-
74
-
75
-
76
-
77
-
78
-
79
-
80
-
81
-
82
-
83
-
84
-
85
-
86
-
87
-
88
-
89
-
90
-
91
-
92
-
93
-
94
-
95
-
96
-
97
-
98
-
99
-
100
-
101
-
102
-
103
-
104
-
105
-
106
-
107
-
108
-
109
-
110
-
111
-
112
-
113
-
114
-
115
-
116
-
117
-
118
-
119
-
120
-
121
-
122
-
123
-
124
-
125
-
126
-
127
-
128
-
129
-
130
-
131
-
132
-
133
-
134
-
135
-
136
-
137
-
138
-
139
-
140
-
141
-
142
-
143
-
144
-
145
-
146
-
147
-
148
-
149
-
150
-
151
-
152
-
153
-
154
-
155
-
156
-
157
-
158
-
159
-
160
-
161
-
162
-
163
-
164
-
165
-
166
-
167
-
168
-
169
-
170
-
171
-
172
-
173
-
174
-
175
-
176
-
177
-
178
-
179
-
180
-
181
-
182
-
183
-
184
-
185
-
186
-
187
-
188
-
189
-
190
-
191
-
192
-
193
-
194
-
195
-
196
-
197
-
198
-
199
-
200
-
201
-
202
-
203
-
204
-
205
-
206
-
207
-
208
-
209
-
210
-
211
-
212
-
213
-
214
-
215
-
216
-
217
-
218
-
219
 |
 |

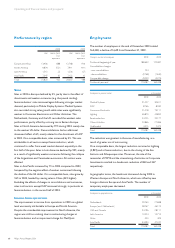
Other Activities
Key data
in millions of euros 2002 2003 2004
Sales 2,971 2,218 2,482
Sales growth
% (decrease) increase, nominal (34) (25) 12
% (decrease) increase, comparable (4) (5) 18
Technology Cluster (274) (293) (323)
Corporate Investments 153 (63) 35
Other (125)93654
Income (loss) from operations (246) (263) 366
asa%ofsales (8.3) (11.9) 14.7
Net operating capital (NOC) (181) 150 117
Number of employees (FTEs) 23,866 27,086 23,869
See pages 210 and 211 for a reconciliation to the most directly comparable US GAAP measures.
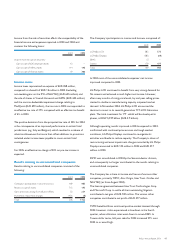
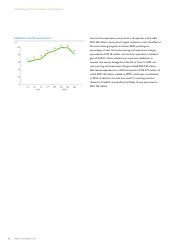
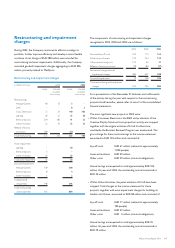
Total Philips R&D expenditures
3,000
4,000
2,000
1,000
0
in millions of euros as a % of sales
20042003200220012000
12%
9%
6%
3%
0%
2,617
2,766
3,043
3,312
2,534
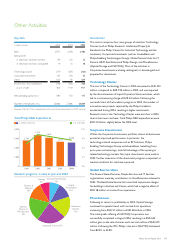
Research programs, in value at year-end 2004
Systems &
Software
13%
Storage
8%
Lighting,
Devices &
MicroSystems
19%
Integrated Circuits 23%
Healthcare
Systems
17%
Imaging
Technologies
12%
Connectivity Solutions
8%
Introduction
This sector comprises four main groups of activities: Technology
Cluster (such as Philips Research, Intellectual Property &
Standards, the Philips Center for Industrial Technology and the
Incubator), Corporate Investments (such as Assembléon and
Philips Enabling Technologies Group), Global Service Units for IT,
Finance, HRM, Real Estate and Philips Design, and Miscellaneous
(Optical Storage and NAVTEQ). Most of the activities in
Corporate Investments are being redesigned, or disentangled and
prepared for divestment.
Technology Cluster
The cost of the Technology Cluster in 2004 amounted to EUR 323
million, compared to EUR 293 million in 2003, and was impacted
by the discontinuation of Liquid Crystal on Silicon activities, which
led to a restructuring charge of EUR 34 million. Following the
successful start of the Incubator program in 2003, the number of
innovative new projects captured by the Philips Incubator
accelerated during 2004, resulting in higher investments.
Research costs in the Technology Cluster were less than in 2003,
due to the lower cost base. Total Philips R&D expenditures were
EUR 2.5 billion, slightly below the 2003 level.
Corporate Investments
Within the Corporate Investments portfolio, almost all businesses
posted an improved performance. In particular, the
technology-related companies such as RF Solutions, Philips
Enabling Technologies Group and Assembléon, benefiting from
prior-year restructurings, took full advantage of the upswing in
related technology markets. No major divestments were made in
2004. Further execution of the divestment program is expected, as
market conditions for sale have improved.
Global Service Units
The Finance Shared Services, People Services and IT Services
organizations were key contributors to the efficiencies achieved in
2004. The Real Estate Service Unit recorded impairment charges
for buildings in Aachen and Vienna, which had a negative effect of
EUR 18 million on income from operations.
Miscellaneous
Following its return to profitability in 2003, Optical Storage
continued its upward trend, with income from operations
increasing from EUR 51 million to EUR 68 million in 2004.
The initial public offering of NAVTEQ Corporation was
successfully completed in August 2004, resulting in a EUR 635
million gain on the sale of shares and a net cash inflow of EUR 672
million. Following the IPO, Philips’ interest in NAVTEQ decreased
from 83.5% to 34.8%.
57Philips Annual Report 2004