Philips 2004 Annual Report Download - page 175
Download and view the complete annual report
Please find page 175 of the 2004 Philips annual report below. You can navigate through the pages in the report by either clicking on the pages listed below, or by using the keyword search tool below to find specific information within the annual report.-
 1
1 -
2
-
3
-
4
-
5
-
6
-
7
-
8
-
9
-
10
-
11
-
12
-
13
-
14
-
15
-
16
-
17
-
18
-
19
-
20
-
21
-
22
-
23
-
24
-
25
-
26
-
27
-
28
-
29
-
30
-
31
-
32
-
33
-
34
-
35
-
36
-
37
-
38
-
39
-
40
-
41
-
42
-
43
-
44
-
45
-
46
-
47
-
48
-
49
-
50
-
51
-
52
-
53
-
54
-
55
-
56
-
57
-
58
-
59
-
60
-
61
-
62
-
63
-
64
-
65
-
66
-
67
-
68
-
69
-
70
-
71
-
72
-
73
-
74
-
75
-
76
-
77
-
78
-
79
-
80
-
81
-
82
-
83
-
84
-
85
-
86
-
87
-
88
-
89
-
90
-
91
-
92
-
93
-
94
-
95
-
96
-
97
-
98
-
99
-
100
-
101
-
102
-
103
-
104
-
105
-
106
-
107
-
108
-
109
-
110
-
111
-
112
-
113
-
114
-
115
-
116
-
117
-
118
-
119
-
120
-
121
-
122
-
123
-
124
-
125
-
126
-
127
-
128
-
129
-
130
-
131
-
132
-
133
-
134
-
135
-
136
-
137
-
138
-
139
-
140
-
141
-
142
-
143
-
144
-
145
-
146
-
147
-
148
-
149
-
150
-
151
-
152
-
153
-
154
-
155
-
156
-
157
-
158
-
159
-
160
-
161
-
162
-
163
-
164
-
 165
165 -
 166
166 -
 167
167 -
 168
168 -
 169
169 -
 170
170 -
 171
171 -
 172
172 -
 173
173 -
 174
174 -
 175
175 -
 176
176 -
 177
177 -
 178
178 -
 179
179 -
 180
180 -
 181
181 -
 182
182 -
 183
183 -
 184
184 -
 185
185 -
186
-
187
-
188
-
189
-
190
-
191
-
192
-
193
-
194
-
195
-
196
-
197
-
198
-
199
-
200
-
201
-
202
-
203
-
204
-
205
-
206
-
207
-
208
-
209
-
210
-
211
-
212
-
213
-
214
-
215
-
216
-
217
-
218
-
219
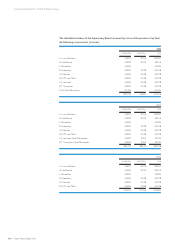
 |
 |

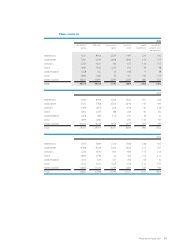
2004
total net total long-lived capital depreciation
assets operating liabilities assets expenditures property,
capital excl. debt plant and
equipment
Medical Systems 4,675 2,862 1,767 2,446 76 81
DAP 816 393 423 433 84 78
Consumer Electronics 2,396 (161) 2,538 217 81 95
Lighting 2,413 1,493 874 1,173 211 197
Semiconductors 4,196 2,669 1,221 2,487 613 752
Other Activities 6,944 117 1,624 896 219 194
Unallocated 9,283 (181) 2,620 152 2 5
Total 30,723 7,192 11,067 7,804 1,286 1,402
2003
Medical Systems 5,420 3,671 1,708 3,246 104 93
DAP 840 464 376 450 89 85
Consumer Electronics 2,370 (82) 2,432 249 87 112
Lighting 2,341 1,521 801 1,167 174 197
Semiconductors 5,777 2,676 1,147 2,370 300 893
Other Activities 4,526 150 1,634 945 224 162
Unallocated 8,137 (329) 2,499 217 2 10
Total 29,411 8,071 10,597 8,644 980 1,552
2002
Medical Systems 6,780 4,849 1,886 4,199 85 87
DAP 961 529 432 501 83 90
Consumer Electronics 2,609 46 2,544 323 107 177
Lighting 2,608 1,723 866 1,290 183 182
Semiconductors 7,394 3,814 1,180 3,647 477 1,021
Other Activities 5,109 (181) 1,712 774 173 217
Unallocated 6,828 (241) 2,462 337 53 40
Total 32,289 10,539 11,082 11,071 1,161 1,814
Goodwill assigned to product sectors
2004
Carrying value
at January 1
Acquisitions Goodwill
amortization
related to sale
of business
Impairment Translation
differences and
other changes
Carrying value
at December
31
Medical Systems 2,045 45 (590) (105) 1,395
DAP 118 (9) 109
Consumer Electronics 26 1 11 38
Lighting 79 11 90
Semiconductors 193 (3) (12) 178
Other Activities 3 (3) –
Unallocated 30 (22)8
Total 2,494 46 – (596) (126) 1,818
174 Philips Annual Report 2004
Financial statements of the Philips Group