Philips 2004 Annual Report Download - page 47
Download and view the complete annual report
Please find page 47 of the 2004 Philips annual report below. You can navigate through the pages in the report by either clicking on the pages listed below, or by using the keyword search tool below to find specific information within the annual report.-
 1
1 -
2
-
3
-
4
-
5
-
6
-
7
-
8
-
9
-
10
-
11
-
12
-
13
-
14
-
15
-
16
-
17
-
18
-
19
-
20
-
21
-
22
-
23
-
24
-
25
-
26
-
27
-
28
-
29
-
30
-
31
-
32
-
33
-
34
-
35
-
36
-
 37
37 -
 38
38 -
 39
39 -
 40
40 -
 41
41 -
 42
42 -
 43
43 -
 44
44 -
 45
45 -
 46
46 -
 47
47 -
 48
48 -
 49
49 -
 50
50 -
 51
51 -
 52
52 -
 53
53 -
 54
54 -
 55
55 -
 56
56 -
 57
57 -
58
-
59
-
60
-
61
-
62
-
63
-
64
-
65
-
66
-
67
-
68
-
69
-
70
-
71
-
72
-
73
-
74
-
75
-
76
-
77
-
78
-
79
-
80
-
81
-
82
-
83
-
84
-
85
-
86
-
87
-
88
-
89
-
90
-
91
-
92
-
93
-
94
-
95
-
96
-
97
-
98
-
99
-
100
-
101
-
102
-
103
-
104
-
105
-
106
-
107
-
108
-
109
-
110
-
111
-
112
-
113
-
114
-
115
-
116
-
117
-
118
-
119
-
120
-
121
-
122
-
123
-
124
-
125
-
126
-
127
-
128
-
129
-
130
-
131
-
132
-
133
-
134
-
135
-
136
-
137
-
138
-
139
-
140
-
141
-
142
-
143
-
144
-
145
-
146
-
147
-
148
-
149
-
150
-
151
-
152
-
153
-
154
-
155
-
156
-
157
-
158
-
159
-
160
-
161
-
162
-
163
-
164
-
165
-
166
-
167
-
168
-
169
-
170
-
171
-
172
-
173
-
174
-
175
-
176
-
177
-
178
-
179
-
180
-
181
-
182
-
183
-
184
-
185
-
186
-
187
-
188
-
189
-
190
-
191
-
192
-
193
-
194
-
195
-
196
-
197
-
198
-
199
-
200
-
201
-
202
-
203
-
204
-
205
-
206
-
207
-
208
-
209
-
210
-
211
-
212
-
213
-
214
-
215
-
216
-
217
-
218
-
219
 |
 |

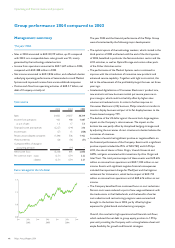
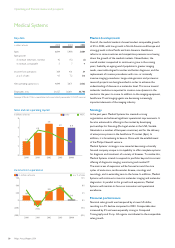
Medical Systems was negatively affected by the impairment charge
for MedQuist (EUR 590 million) and the Volumetrics settlement
(EUR 133 million, net of recoveries from insurance). Excluding
these items, Medical Systems posted an improvement in income
from operations to EUR 757 million. This improved performance
was fueled by the introduction of innovative new products and
improved service capability, which resulted in strong order rates
and higher market shares. Tight control of costs and process
improvements also contributed. Performance improvements at
Lighting were due to the recovery of some major markets, along
with innovation and solid cost control.
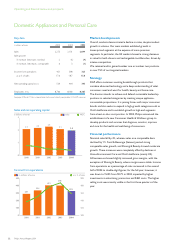
Faced with intensified competition, DAP did not match 2003
profitability. Together with increased costs, especially for
advertising and promotion, this resulted in a EUR 75 million
decline in income from operations compared to 2003.
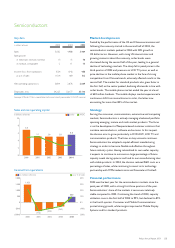
Benefiting from the industry upturn that was visible especially in
the first half of 2004, Semiconductors was one of the major drivers
of the Company’s improved income from operations. Its
performance improvement was the result of higher capacity
utilization, lower R&D spending and the positive effects of earlier
restructuring programs. By the end of the year, however, fab
utilization declined to approximately the same level as a year
earlier.
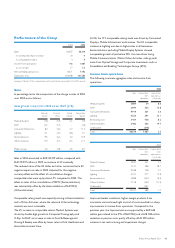
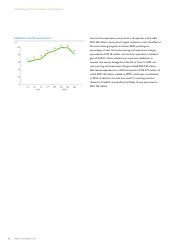
Income from operations for Licenses
20042003200220012000
500
400
300
200
100
0
311
188
297
351
478
252
in millions of euros of which past-
use income
of which current-
use income
93
39
121
22
289 258 149 176 226
The operational performance of Consumer Electronics was
affected by competitive pressures, especially in Europe. Despite
the successful progress of the Business Renewal Program, income
from operations for CE, excluding License income, was below the
level achieved in 2003, due to a faster-than-expected decline in
gross margins. License income improved by EUR 181 million
compared to 2003, to an amount of EUR 478 million. Past-use
license income and general settlements made an exceptionally
strong contribution to income (EUR 252 million). Such a
contribution is generally not expected to recur in the coming
years.
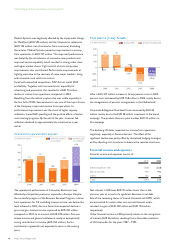
Total pension (costs) / benefits
(112)
(284)
in millions of euros
397
25
350
61
600
400
200
0
(400)
(200)
(600)
(223)
(442)
(164)
(130) (219) (172)
20042003200220012000
of which Unallocatedof which PDs
34
422 411
After a EUR 312 million increase in Group pension costs in 2003,
pension costs decreased by EUR 158 million in 2004, mainly due to
the renegotiation of pension arrangements in the Netherlands.
Corporate & Regional Overhead Costs increased by EUR 60
million, mainly due to the EUR 58 million investment in the brand
campaign. The product divisions spent another EUR 22 million on
this campaign.
The declining US dollar impacted our income from operations
negatively, especially at Semiconductors. The effect of this
significant decline was partly offset by disciplined hedging strategies
and by adjusting cost structures to balance the revenue structures.
Financial income and expenses
Financial income and expenses consist of:
2003 2004
Interest expenses (net) (328) (258)
Sale of securities 146 442
Other (62) 32
Total (244) 216
Net interest in 2004 was EUR 70 million lower than in the
previous year as a result of a significant decrease in net debt.
Sale of the remaining shares in Vivendi Universal and ASML, which
are accounted for under other non-current financial assets,
resulted in a gain of EUR 300 million and EUR 140 million
respectively.
Other financial income in 2004 primarily relates to the recognition
of interest (EUR 46 million) resulting from a favorable resolution
of US fiscal audits for the years 1987 – 1992.
46 Philips Annual Report 2004
Operating and financial review and prospects